Some Confidence Is Lacking In Danto Holdings Corporation (TSE:5337) As Shares Slide 26%

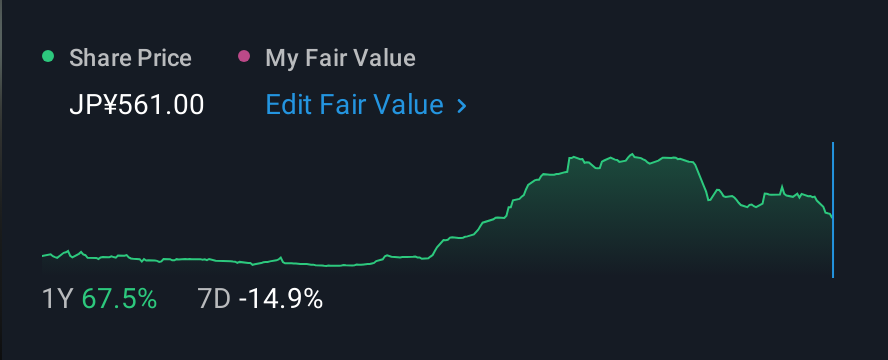
Danto Holdings Corporation (TSE:5337) shares have retraced a considerable 26% in the last month, reversing a fair amount of their solid recent performance. Longer-term, the stock has been solid despite a difficult 30 days, gaining 23% in the last year.
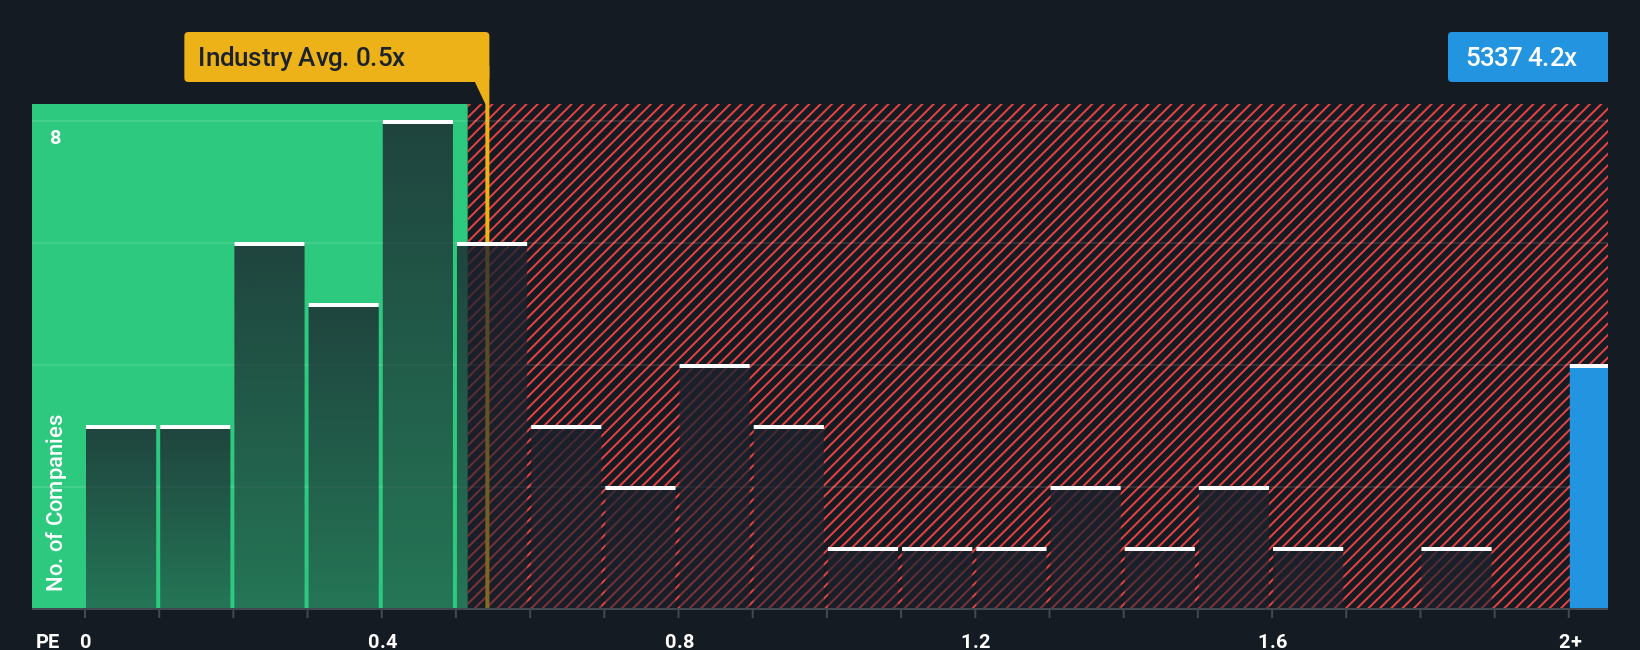
In spite of the heavy fall in price, when almost half of the companies in Japan's Building industry have price-to-sales ratios (or "P/S") below 0.5x, you may still consider Danto Holdings as a stock not worth researching with its 4.2x P/S ratio. However, the P/S might be quite high for a reason and it requires further investigation to determine if it's justified.
Check out our latest analysis for Danto Holdings

What Does Danto Holdings' P/S Mean For Shareholders?
As an illustration, revenue has deteriorated at Danto Holdings over the last year, which is not ideal at all. Perhaps the market believes the company can do enough to outperform the rest of the industry in the near future, which is keeping the P/S ratio high. You'd really hope so, otherwise you're paying a pretty hefty price for no particular reason.
Want the full picture on earnings, revenue and cash flow for the company? Then our free report on Danto Holdings will help you shine a light on its historical performance.Is There Enough Revenue Growth Forecasted For Danto Holdings?
Danto Holdings' P/S ratio would be typical for a company that's expected to deliver very strong growth, and importantly, perform much better than the industry.
Retrospectively, the last year delivered a frustrating 11% decrease to the company's top line. Regardless, revenue has managed to lift by a handy 6.9% in aggregate from three years ago, thanks to the earlier period of growth. So we can start by confirming that the company has generally done a good job of growing revenue over that time, even though it had some hiccups along the way.
It's interesting to note that the rest of the industry is similarly expected to grow by 4.0% over the next year, which is fairly even with the company's recent medium-term annualised growth rates.
With this information, we find it interesting that Danto Holdings is trading at a high P/S compared to the industry. Apparently many investors in the company are more bullish than recent times would indicate and aren't willing to let go of their stock right now. Although, additional gains will be difficult to achieve as a continuation of recent revenue trends would weigh down the share price eventually.
What Does Danto Holdings' P/S Mean For Investors?
Danto Holdings' shares may have suffered, but its P/S remains high. We'd say the price-to-sales ratio's power isn't primarily as a valuation instrument but rather to gauge current investor sentiment and future expectations.
Our examination of Danto Holdings revealed its three-year revenue trends aren't impacting its high P/S as much as we would have predicted, given they look similar to current industry expectations. Right now we are uncomfortable with the high P/S as this revenue performance isn't likely to support such positive sentiment for long. If recent medium-term revenue trends continue, it will place shareholders' investments at risk and potential investors in danger of paying an unnecessary premium.
Before you take the next step, you should know about the 2 warning signs for Danto Holdings that we have uncovered.
Of course, profitable companies with a history of great earnings growth are generally safer bets. So you may wish to see this free collection of other companies that have reasonable P/E ratios and have grown earnings strongly.
New: Manage All Your Stock Portfolios in One Place
We've created the ultimate portfolio companion for stock investors, and it's free.
• Connect an unlimited number of Portfolios and see your total in one currency
• Be alerted to new Warning Signs or Risks via email or mobile
• Track the Fair Value of your stocks
Have feedback on this article? Concerned about the content? Get in touch with us directly. Alternatively, email editorial-team (at) simplywallst.com.
This article by Simply Wall St is general in nature. We provide commentary based on historical data and analyst forecasts only using an unbiased methodology and our articles are not intended to be financial advice. It does not constitute a recommendation to buy or sell any stock, and does not take account of your objectives, or your financial situation. We aim to bring you long-term focused analysis driven by fundamental data. Note that our analysis may not factor in the latest price-sensitive company announcements or qualitative material. Simply Wall St has no position in any stocks mentioned.
About TSE:5337
Danto Holdings
Manufactures, sells, and installs ceramics and related products in Japan.
Adequate balance sheet with questionable track record.
Market Insights
Community Narratives


