
Advertisement
- Japan
- /
- Construction
- /
- TSE:5076
INFRONEER Holdings Inc. (TSE:5076) Is Going Strong But Fundamentals Appear To Be Mixed : Is There A Clear Direction For The Stock?
INFRONEER Holdings (TSE:5076) has had a great run on the share market with its stock up by a significant 35% over the last three months. However, we decided to pay attention to the company's fundamentals which don't appear to give a clear sign about the company's financial health. Particularly, we will be paying attention to INFRONEER Holdings' ROE today.
Return on equity or ROE is a key measure used to assess how efficiently a company's management is utilizing the company's capital. Put another way, it reveals the company's success at turning shareholder investments into profits.
How Do You Calculate Return On Equity?
The formula for ROE is:
Return on Equity = Net Profit (from continuing operations) ÷ Shareholders' Equity
So, based on the above formula, the ROE for INFRONEER Holdings is:
8.5% = JP¥49b ÷ JP¥578b (Based on the trailing twelve months to September 2025).
The 'return' is the income the business earned over the last year. So, this means that for every ¥1 of its shareholder's investments, the company generates a profit of ¥0.09.
Check out our latest analysis for INFRONEER Holdings
Why Is ROE Important For Earnings Growth?
Thus far, we have learned that ROE measures how efficiently a company is generating its profits. We now need to evaluate how much profit the company reinvests or "retains" for future growth which then gives us an idea about the growth potential of the company. Assuming all else is equal, companies that have both a higher return on equity and higher profit retention are usually the ones that have a higher growth rate when compared to companies that don't have the same features.
INFRONEER Holdings' Earnings Growth And 8.5% ROE
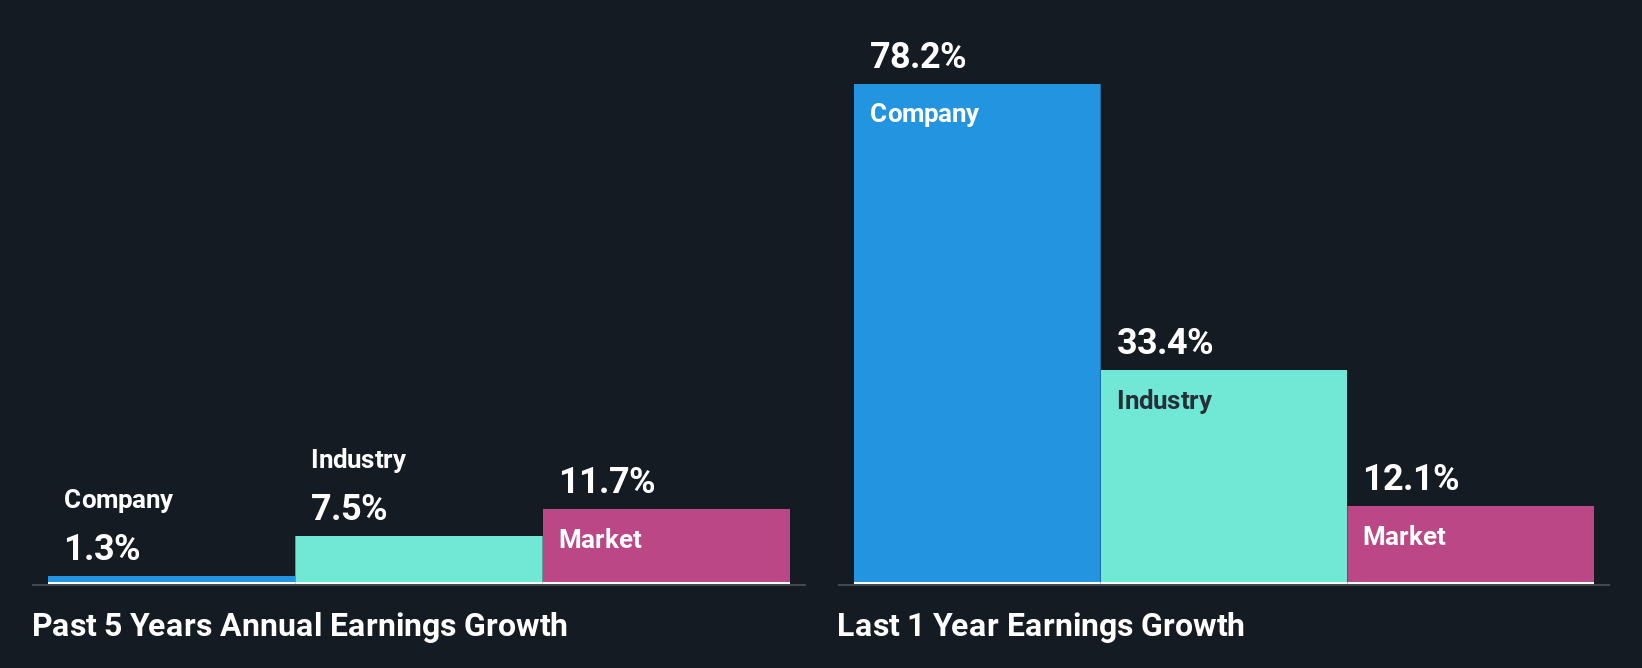
On the face of it, INFRONEER Holdings' ROE is not much to talk about. However, its ROE is similar to the industry average of 9.3%, so we won't completely dismiss the company. However, INFRONEER Holdings has seen a flattish net income growth over the past five years, which is not saying much. Remember, the company's ROE is not particularly great to begin with. Hence, this provides some context to the flat earnings growth seen by the company.
We then compared INFRONEER Holdings' net income growth with the industry and found that the company's growth figure is lower than the average industry growth rate of 7.5% in the same 5-year period, which is a bit concerning.
The basis for attaching value to a company is, to a great extent, tied to its earnings growth. What investors need to determine next is if the expected earnings growth, or the lack of it, is already built into the share price. Doing so will help them establish if the stock's future looks promising or ominous. If you're wondering about INFRONEER Holdings''s valuation, check out this gauge of its price-to-earnings ratio, as compared to its industry.
Is INFRONEER Holdings Efficiently Re-investing Its Profits?
In spite of a normal three-year median payout ratio of 46% (or a retention ratio of 54%), INFRONEER Holdings hasn't seen much growth in its earnings. So there could be some other explanation in that regard. For instance, the company's business may be deteriorating.
Moreover, INFRONEER Holdings has been paying dividends for four years, which is a considerable amount of time, suggesting that management must have perceived that the shareholders prefer dividends over earnings growth.
Conclusion
In total, we're a bit ambivalent about INFRONEER Holdings' performance. While the company does have a high rate of profit retention, its low rate of return is probably hampering its earnings growth. We also studied the latest analyst forecasts and found that the company's earnings growth is expected be similar to its current growth rate. To know more about the latest analysts predictions for the company, check out this visualization of analyst forecasts for the company.
New: AI Stock Screener & Alerts
Our new AI Stock Screener scans the market every day to uncover opportunities.
• Dividend Powerhouses (3%+ Yield)
• Undervalued Small Caps with Insider Buying
• High growth Tech and AI Companies
Or build your own from over 50 metrics.
Have feedback on this article? Concerned about the content? Get in touch with us directly. Alternatively, email editorial-team (at) simplywallst.com.
This article by Simply Wall St is general in nature. We provide commentary based on historical data and analyst forecasts only using an unbiased methodology and our articles are not intended to be financial advice. It does not constitute a recommendation to buy or sell any stock, and does not take account of your objectives, or your financial situation. We aim to bring you long-term focused analysis driven by fundamental data. Note that our analysis may not factor in the latest price-sensitive company announcements or qualitative material. Simply Wall St has no position in any stocks mentioned.
About TSE:5076
Solid track record average dividend payer.
Market Insights

Advertisement
Community Narratives
MicroVision will explode future revenue by 380.37% with a vision towards success
Fair Value US$60|98.4% undervalued
TH
Community Contributor
The Indispensable Artery for a New North American Economy
Fair Value CA$132.87|0.7% overvalued
TI
Community Contributor
Recently Updated Narratives
CE

cementafriend on Constellation Energy ·
Constellation Energy Dividends and Growth
Fair Value:US$348.054.7% overvalued
2 followersusers have followed this narrative
0 commentsusers have commented on this narrative
0 likesusers have liked this narrative
KH

Khagani on CoreWeave ·
CoreWeave's Revenue Expected to Rocket 77.88% in 5-Year Forecast
Fair Value:US$11033.5% undervalued
3 followersusers have followed this narrative
0 commentsusers have commented on this narrative
0 likesusers have liked this narrative
PO

PortfolioPlus on Bisalloy Steel Group ·
Bisalloy Steel Group will shine with a projected profit margin increase of 12.8%
Fair Value:AU$6.7118.0% undervalued
3 followersusers have followed this narrative
0 commentsusers have commented on this narrative
0 likesusers have liked this narrative
Popular Narratives
TH

TheWallstreetKing on MicroVision ·
MicroVision will explode future revenue by 380.37% with a vision towards success
Fair Value:US$6098.4% undervalued
106 followersusers have followed this narrative
10 commentsusers have commented on this narrative
21 likesusers have liked this narrative
AN


AnalystConsensusTarget on NVIDIA ·
NVDA: Expanding AI Demand Will Drive Major Data Center Investments Through 2026
Fair Value:US$250.3929.3% undervalued
936 followersusers have followed this narrative
6 commentsusers have commented on this narrative
24 likesusers have liked this narrative
OS


oscargarcia on Alphabet ·
The company that turned a verb into a global necessity and basically runs the modern internet, digital ads, smartphones, maps, and AI.
Fair Value:US$3405.8% undervalued
143 followersusers have followed this narrative
6 commentsusers have commented on this narrative
18 likesusers have liked this narrative