- Japan
- /
- Construction
- /
- TSE:5074
Investors Still Aren't Entirely Convinced By Tess Holdings Co.,Ltd.'s (TSE:5074) Revenues Despite 30% Price Jump


Tess Holdings Co.,Ltd. (TSE:5074) shares have had a really impressive month, gaining 30% after a shaky period beforehand. Not all shareholders will be feeling jubilant, since the share price is still down a very disappointing 25% in the last twelve months.
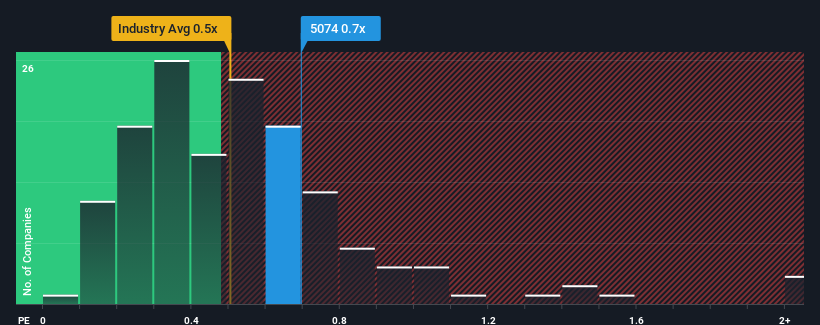
Even after such a large jump in price, there still wouldn't be many who think Tess HoldingsLtd's price-to-sales (or "P/S") ratio of 0.7x is worth a mention when the median P/S in Japan's Construction industry is similar at about 0.5x. However, investors might be overlooking a clear opportunity or potential setback if there is no rational basis for the P/S.
Our free stock report includes 4 warning signs investors should be aware of before investing in Tess HoldingsLtd. Read for free now.Check out our latest analysis for Tess HoldingsLtd
How Tess HoldingsLtd Has Been Performing
With revenue growth that's inferior to most other companies of late, Tess HoldingsLtd has been relatively sluggish. Perhaps the market is expecting future revenue performance to lift, which has kept the P/S from declining. If not, then existing shareholders may be a little nervous about the viability of the share price.
If you'd like to see what analysts are forecasting going forward, you should check out our free report on Tess HoldingsLtd.Do Revenue Forecasts Match The P/S Ratio?
Tess HoldingsLtd's P/S ratio would be typical for a company that's only expected to deliver moderate growth, and importantly, perform in line with the industry.
Taking a look back first, we see that there was hardly any revenue growth to speak of for the company over the past year. The lack of growth did nothing to help the company's aggregate three-year performance, which is an unsavory 8.1% drop in revenue. So unfortunately, we have to acknowledge that the company has not done a great job of growing revenue over that time.
Looking ahead now, revenue is anticipated to climb by 20% each year during the coming three years according to the dual analysts following the company. With the industry only predicted to deliver 2.2% per year, the company is positioned for a stronger revenue result.
With this information, we find it interesting that Tess HoldingsLtd is trading at a fairly similar P/S compared to the industry. Apparently some shareholders are skeptical of the forecasts and have been accepting lower selling prices.
What Does Tess HoldingsLtd's P/S Mean For Investors?
Tess HoldingsLtd's stock has a lot of momentum behind it lately, which has brought its P/S level with the rest of the industry. Generally, our preference is to limit the use of the price-to-sales ratio to establishing what the market thinks about the overall health of a company.
We've established that Tess HoldingsLtd currently trades on a lower than expected P/S since its forecasted revenue growth is higher than the wider industry. There could be some risks that the market is pricing in, which is preventing the P/S ratio from matching the positive outlook. It appears some are indeed anticipating revenue instability, because these conditions should normally provide a boost to the share price.
Before you settle on your opinion, we've discovered 4 warning signs for Tess HoldingsLtd (2 are a bit concerning!) that you should be aware of.
If you're unsure about the strength of Tess HoldingsLtd's business, why not explore our interactive list of stocks with solid business fundamentals for some other companies you may have missed.
Valuation is complex, but we're here to simplify it.
Discover if Tess HoldingsLtd might be undervalued or overvalued with our detailed analysis, featuring fair value estimates, potential risks, dividends, insider trades, and its financial condition.
Access Free AnalysisHave feedback on this article? Concerned about the content? Get in touch with us directly. Alternatively, email editorial-team (at) simplywallst.com.
This article by Simply Wall St is general in nature. We provide commentary based on historical data and analyst forecasts only using an unbiased methodology and our articles are not intended to be financial advice. It does not constitute a recommendation to buy or sell any stock, and does not take account of your objectives, or your financial situation. We aim to bring you long-term focused analysis driven by fundamental data. Note that our analysis may not factor in the latest price-sensitive company announcements or qualitative material. Simply Wall St has no position in any stocks mentioned.
About TSE:5074
Tess HoldingsLtd
Engages in the engineering and energy supply businesses.
Slight with moderate growth potential.
Market Insights

Community Narratives

