

David Iben put it well when he said, 'Volatility is not a risk we care about. What we care about is avoiding the permanent loss of capital.' So it seems the smart money knows that debt - which is usually involved in bankruptcies - is a very important factor, when you assess how risky a company is. As with many other companies TriIs Incorporated (TSE:4840) makes use of debt. But is this debt a concern to shareholders?
When Is Debt Dangerous?
Generally speaking, debt only becomes a real problem when a company can't easily pay it off, either by raising capital or with its own cash flow. Ultimately, if the company can't fulfill its legal obligations to repay debt, shareholders could walk away with nothing. However, a more common (but still painful) scenario is that it has to raise new equity capital at a low price, thus permanently diluting shareholders. Of course, debt can be an important tool in businesses, particularly capital heavy businesses. When we examine debt levels, we first consider both cash and debt levels, together.
Check out our latest analysis for TriIs
What Is TriIs's Debt?
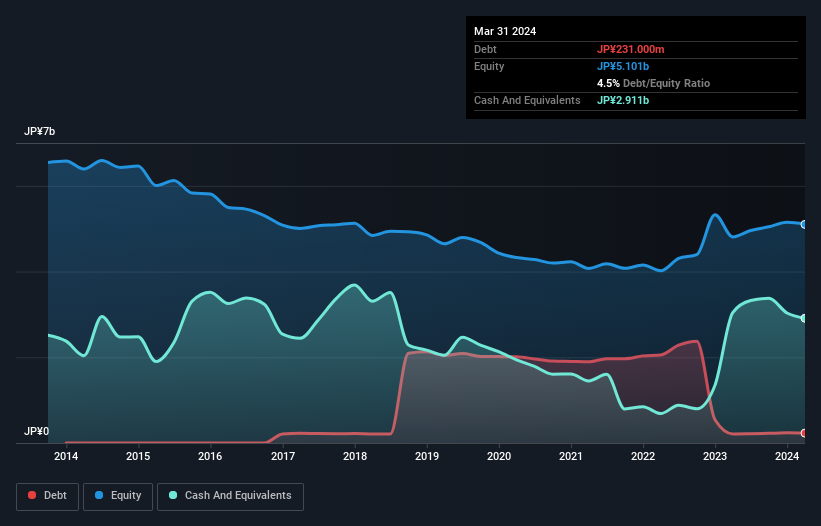
You can click the graphic below for the historical numbers, but it shows that as of March 2024 TriIs had JP¥231.0m of debt, an increase on JP¥212.0m, over one year. However, its balance sheet shows it holds JP¥2.91b in cash, so it actually has JP¥2.68b net cash.
A Look At TriIs' Liabilities
Zooming in on the latest balance sheet data, we can see that TriIs had liabilities of JP¥215.0m due within 12 months and liabilities of JP¥238.0m due beyond that. On the other hand, it had cash of JP¥2.91b and JP¥28.0m worth of receivables due within a year. So it can boast JP¥2.49b more liquid assets than total liabilities.
This luscious liquidity implies that TriIs' balance sheet is sturdy like a giant sequoia tree. Having regard to this fact, we think its balance sheet is as strong as an ox. Simply put, the fact that TriIs has more cash than debt is arguably a good indication that it can manage its debt safely. When analysing debt levels, the balance sheet is the obvious place to start. But it is TriIs's earnings that will influence how the balance sheet holds up in the future. So when considering debt, it's definitely worth looking at the earnings trend. Click here for an interactive snapshot.
Over 12 months, TriIs made a loss at the EBIT level, and saw its revenue drop to JP¥654m, which is a fall of 12%. That's not what we would hope to see.
So How Risky Is TriIs?
We have no doubt that loss making companies are, in general, riskier than profitable ones. And in the last year TriIs had an earnings before interest and tax (EBIT) loss, truth be told. And over the same period it saw negative free cash outflow of JP¥569m and booked a JP¥31m accounting loss. With only JP¥2.68b on the balance sheet, it would appear that its going to need to raise capital again soon. Even though its balance sheet seems sufficiently liquid, debt always makes us a little nervous if a company doesn't produce free cash flow regularly. The balance sheet is clearly the area to focus on when you are analysing debt. But ultimately, every company can contain risks that exist outside of the balance sheet. These risks can be hard to spot. Every company has them, and we've spotted 2 warning signs for TriIs you should know about.
When all is said and done, sometimes its easier to focus on companies that don't even need debt. Readers can access a list of growth stocks with zero net debt 100% free, right now.
Valuation is complex, but we're here to simplify it.
Discover if TriIs might be undervalued or overvalued with our detailed analysis, featuring fair value estimates, potential risks, dividends, insider trades, and its financial condition.
Access Free AnalysisHave feedback on this article? Concerned about the content? Get in touch with us directly. Alternatively, email editorial-team (at) simplywallst.com.
This article by Simply Wall St is general in nature. We provide commentary based on historical data and analyst forecasts only using an unbiased methodology and our articles are not intended to be financial advice. It does not constitute a recommendation to buy or sell any stock, and does not take account of your objectives, or your financial situation. We aim to bring you long-term focused analysis driven by fundamental data. Note that our analysis may not factor in the latest price-sensitive company announcements or qualitative material. Simply Wall St has no position in any stocks mentioned.
Have feedback on this article? Concerned about the content? Get in touch with us directly. Alternatively, email editorial-team@simplywallst.com
About TSE:4840
TriIs
Engages in the construction consulting and fashion businesses in Japan and internationally.
Solid track record with excellent balance sheet.
Market Insights

Community Narratives

