
Advertisement
Takahashi Curtain Wall's (TSE:1994) Shareholders May Want To Dig Deeper Than Statutory Profit

The stock price didn't jump after Takahashi Curtain Wall Corporation (TSE:1994) posted decent earnings last week. We did some digging and believe investors may be worried about some underlying factors in the report.
Check out our latest analysis for Takahashi Curtain Wall
Zooming In On Takahashi Curtain Wall's Earnings
As finance nerds would already know, the accrual ratio from cashflow is a key measure for assessing how well a company's free cash flow (FCF) matches its profit. To get the accrual ratio we first subtract FCF from profit for a period, and then divide that number by the average operating assets for the period. The ratio shows us how much a company's profit exceeds its FCF.
As a result, a negative accrual ratio is a positive for the company, and a positive accrual ratio is a negative. While it's not a problem to have a positive accrual ratio, indicating a certain level of non-cash profits, a high accrual ratio is arguably a bad thing, because it indicates paper profits are not matched by cash flow. That's because some academic studies have suggested that high accruals ratios tend to lead to lower profit or less profit growth.
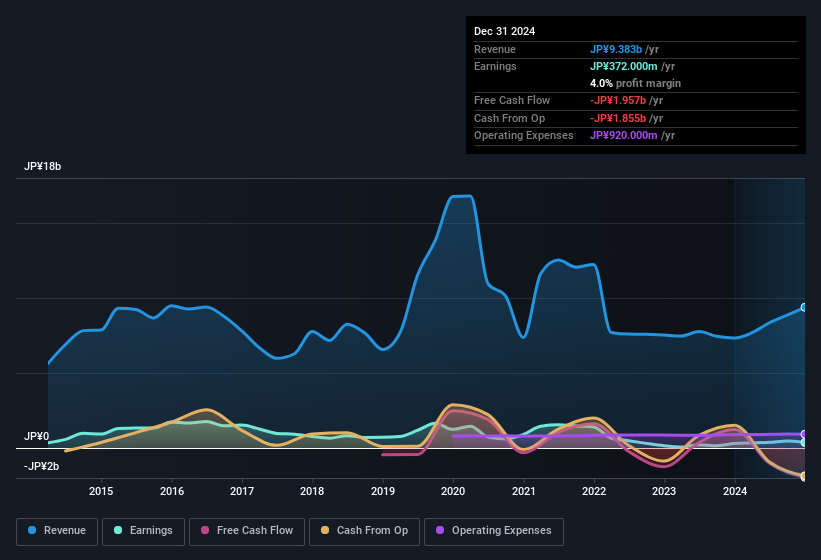
Takahashi Curtain Wall has an accrual ratio of 0.24 for the year to December 2024. We can therefore deduce that its free cash flow fell well short of covering its statutory profit. In the last twelve months it actually had negative free cash flow, with an outflow of JP¥2.0b despite its profit of JP¥372.0m, mentioned above. It's worth noting that Takahashi Curtain Wall generated positive FCF of JP¥1.2b a year ago, so at least they've done it in the past. One positive for Takahashi Curtain Wall shareholders is that it's accrual ratio was significantly better last year, providing reason to believe that it may return to stronger cash conversion in the future. As a result, some shareholders may be looking for stronger cash conversion in the current year.
Note: we always recommend investors check balance sheet strength. Click here to be taken to our balance sheet analysis of Takahashi Curtain Wall.
Our Take On Takahashi Curtain Wall's Profit Performance
Takahashi Curtain Wall's accrual ratio for the last twelve months signifies cash conversion is less than ideal, which is a negative when it comes to our view of its earnings. Therefore, it seems possible to us that Takahashi Curtain Wall's true underlying earnings power is actually less than its statutory profit. The good news is that, its earnings per share increased by 27% in the last year. At the end of the day, it's essential to consider more than just the factors above, if you want to understand the company properly. Keep in mind, when it comes to analysing a stock it's worth noting the risks involved. When we did our research, we found 4 warning signs for Takahashi Curtain Wall (2 are concerning!) that we believe deserve your full attention.
This note has only looked at a single factor that sheds light on the nature of Takahashi Curtain Wall's profit. But there is always more to discover if you are capable of focussing your mind on minutiae. Some people consider a high return on equity to be a good sign of a quality business. While it might take a little research on your behalf, you may find this free collection of companies boasting high return on equity, or this list of stocks with significant insider holdings to be useful.
Valuation is complex, but we're here to simplify it.
Discover if Takahashi Curtain Wall might be undervalued or overvalued with our detailed analysis, featuring fair value estimates, potential risks, dividends, insider trades, and its financial condition.
Access Free AnalysisHave feedback on this article? Concerned about the content? Get in touch with us directly. Alternatively, email editorial-team (at) simplywallst.com.
This article by Simply Wall St is general in nature. We provide commentary based on historical data and analyst forecasts only using an unbiased methodology and our articles are not intended to be financial advice. It does not constitute a recommendation to buy or sell any stock, and does not take account of your objectives, or your financial situation. We aim to bring you long-term focused analysis driven by fundamental data. Note that our analysis may not factor in the latest price-sensitive company announcements or qualitative material. Simply Wall St has no position in any stocks mentioned.
About TSE:1994
Takahashi Curtain Wall
Engages in the PC curtain wall and aqua businesses in Japan.
Excellent balance sheet average dividend payer.
Market Insights

Advertisement
Community Narratives

BMW cruising ahead with new EVs and premium models to boost revenue 5%
Fair Value €135.07|44.6% undervalued
UN
Community Contributor
EU#2 - From Humble Beginnings to Global Powerhouse
Fair Value DKK 851.04|46.4% undervalued
TO
Community Contributor