
Advertisement
- Japan
- /
- Construction
- /
- TSE:1966
Takada Corporation (TSE:1966) Might Not Be As Mispriced As It Looks After Plunging 31%
Unfortunately for some shareholders, the Takada Corporation (TSE:1966) share price has dived 31% in the last thirty days, prolonging recent pain. The last month has meant the stock is now only up 6.5% during the last year.
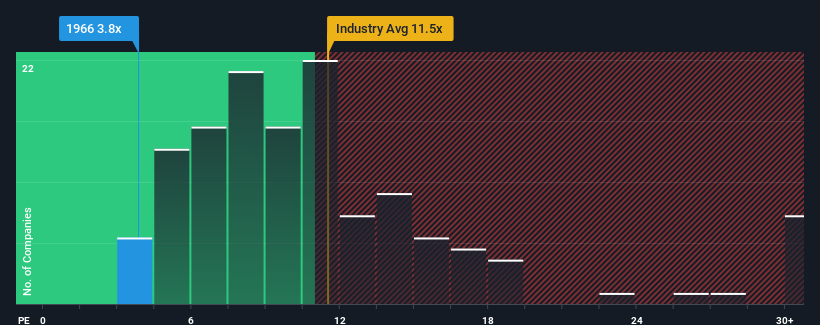
Although its price has dipped substantially, Takada may still be sending very bullish signals at the moment with its price-to-earnings (or "P/E") ratio of 3.8x, since almost half of all companies in Japan have P/E ratios greater than 14x and even P/E's higher than 21x are not unusual. Nonetheless, we'd need to dig a little deeper to determine if there is a rational basis for the highly reduced P/E.
It looks like earnings growth has deserted Takada recently, which is not something to boast about. One possibility is that the P/E is low because investors think this benign earnings growth rate will likely underperform the broader market in the near future. If not, then existing shareholders may be feeling optimistic about the future direction of the share price.
See our latest analysis for Takada
What Are Growth Metrics Telling Us About The Low P/E?
The only time you'd be truly comfortable seeing a P/E as depressed as Takada's is when the company's growth is on track to lag the market decidedly.
Taking a look back first, we see that there was hardly any earnings per share growth to speak of for the company over the past year. Although pleasingly EPS has lifted 60% in aggregate from three years ago, notwithstanding the last 12 months. Therefore, it's fair to say the earnings growth recently has been superb for the company.
Weighing that recent medium-term earnings trajectory against the broader market's one-year forecast for expansion of 9.8% shows it's noticeably more attractive on an annualised basis.
With this information, we find it odd that Takada is trading at a P/E lower than the market. Apparently some shareholders believe the recent performance has exceeded its limits and have been accepting significantly lower selling prices.
What We Can Learn From Takada's P/E?
Having almost fallen off a cliff, Takada's share price has pulled its P/E way down as well. Generally, our preference is to limit the use of the price-to-earnings ratio to establishing what the market thinks about the overall health of a company.
Our examination of Takada revealed its three-year earnings trends aren't contributing to its P/E anywhere near as much as we would have predicted, given they look better than current market expectations. There could be some major unobserved threats to earnings preventing the P/E ratio from matching this positive performance. At least price risks look to be very low if recent medium-term earnings trends continue, but investors seem to think future earnings could see a lot of volatility.
It's always necessary to consider the ever-present spectre of investment risk. We've identified 3 warning signs with Takada (at least 1 which is a bit unpleasant), and understanding them should be part of your investment process.
Of course, you might also be able to find a better stock than Takada. So you may wish to see this free collection of other companies that have reasonable P/E ratios and have grown earnings strongly.
Valuation is complex, but we're here to simplify it.
Discover if Takada might be undervalued or overvalued with our detailed analysis, featuring fair value estimates, potential risks, dividends, insider trades, and its financial condition.
Access Free AnalysisHave feedback on this article? Concerned about the content? Get in touch with us directly. Alternatively, email editorial-team (at) simplywallst.com.
This article by Simply Wall St is general in nature. We provide commentary based on historical data and analyst forecasts only using an unbiased methodology and our articles are not intended to be financial advice. It does not constitute a recommendation to buy or sell any stock, and does not take account of your objectives, or your financial situation. We aim to bring you long-term focused analysis driven by fundamental data. Note that our analysis may not factor in the latest price-sensitive company announcements or qualitative material. Simply Wall St has no position in any stocks mentioned.
Have feedback on this article? Concerned about the content? Get in touch with us directly. Alternatively, email editorial-team@simplywallst.com
About TSE:1966
Takada
Engages in the plant, engineering, plant diagnosis, and electronics equipment businesses in Japan and internationally.
Adequate balance sheet average dividend payer.
Market Insights

Advertisement
Community Narratives
The Next Phase of Energy Storage: How NeoVolta Is Tackling America’s Power Crunch
Fair Value US$7.50|35.1% undervalued
MA
Community Contributor
Why EnSilica is Worth Possibly 13x its Current Price
Fair Value UK£5.00|89.8% undervalued
DO
Community Contributor
M&A Activity, Industry Diversification & A Defense Contract Monopoly Will Push BWXT For Healthy Long-Term Growth
Fair Value US$220.00|15.2% undervalued
CL
Community Contributor
A case for Cassiar Gold Corp (TSXV: GLDC) to reach CAD$8-10 before 2030 (X30-37)
Fair Value CA$10.00|96.0% undervalued
AG
Community Contributor