
Advertisement
- Japan
- /
- Construction
- /
- TSE:1959
Kyudenko Corporation's (TSE:1959) Stock Is Going Strong: Is the Market Following Fundamentals?

Most readers would already be aware that Kyudenko's (TSE:1959) stock increased significantly by 5.7% over the past week. Given that the market rewards strong financials in the long-term, we wonder if that is the case in this instance. Specifically, we decided to study Kyudenko's ROE in this article.
Return on equity or ROE is a key measure used to assess how efficiently a company's management is utilizing the company's capital. In other words, it is a profitability ratio which measures the rate of return on the capital provided by the company's shareholders.
How Do You Calculate Return On Equity?
The formula for return on equity is:
Return on Equity = Net Profit (from continuing operations) ÷ Shareholders' Equity
So, based on the above formula, the ROE for Kyudenko is:
11% = JP¥32b ÷ JP¥303b (Based on the trailing twelve months to December 2024).
The 'return' refers to a company's earnings over the last year. So, this means that for every ¥1 of its shareholder's investments, the company generates a profit of ¥0.11.
Check out our latest analysis for Kyudenko
Why Is ROE Important For Earnings Growth?
So far, we've learned that ROE is a measure of a company's profitability. We now need to evaluate how much profit the company reinvests or "retains" for future growth which then gives us an idea about the growth potential of the company. Generally speaking, other things being equal, firms with a high return on equity and profit retention, have a higher growth rate than firms that don’t share these attributes.
Kyudenko's Earnings Growth And 11% ROE
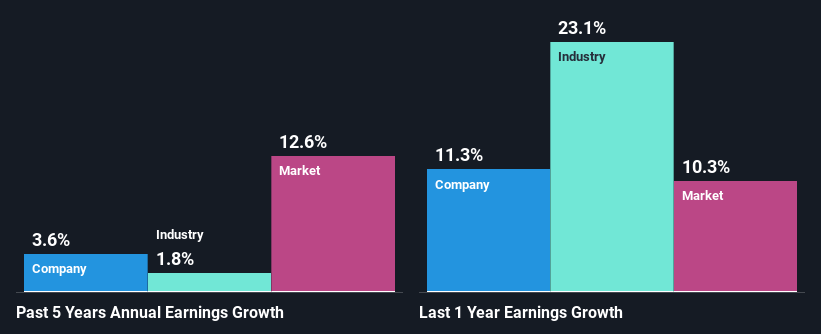
At first glance, Kyudenko seems to have a decent ROE. On comparing with the average industry ROE of 8.4% the company's ROE looks pretty remarkable. Yet, Kyudenko has posted measly growth of 3.6% over the past five years. This is interesting as the high returns should mean that the company has the ability to generate high growth but for some reason, it hasn't been able to do so. Such a scenario is likely to take place when a company pays out a huge portion of its earnings as dividends, or is faced with competitive pressures.
We then compared Kyudenko's net income growth with the industry and we're pleased to see that the company's growth figure is higher when compared with the industry which has a growth rate of 1.8% in the same 5-year period.
Earnings growth is a huge factor in stock valuation. What investors need to determine next is if the expected earnings growth, or the lack of it, is already built into the share price. Doing so will help them establish if the stock's future looks promising or ominous. Has the market priced in the future outlook for 1959? You can find out in our latest intrinsic value infographic research report.
Is Kyudenko Efficiently Re-investing Its Profits?
While Kyudenko has a decent three-year median payout ratio of 29% (or a retention ratio of 71%), it has seen very little growth in earnings. So there could be some other explanation in that regard. For instance, the company's business may be deteriorating.
In addition, Kyudenko has been paying dividends over a period of at least ten years suggesting that keeping up dividend payments is way more important to the management even if it comes at the cost of business growth.
Conclusion
On the whole, we feel that Kyudenko's performance has been quite good. Specifically, we like that the company is reinvesting a huge chunk of its profits at a high rate of return. This of course has caused the company to see substantial growth in its earnings. That being so, the latest analyst forecasts show that the company will continue to see an expansion in its earnings. To know more about the company's future earnings growth forecasts take a look at this free report on analyst forecasts for the company to find out more.
Valuation is complex, but we're here to simplify it.
Discover if Kyudenko might be undervalued or overvalued with our detailed analysis, featuring fair value estimates, potential risks, dividends, insider trades, and its financial condition.
Access Free AnalysisHave feedback on this article? Concerned about the content? Get in touch with us directly. Alternatively, email editorial-team (at) simplywallst.com.
This article by Simply Wall St is general in nature. We provide commentary based on historical data and analyst forecasts only using an unbiased methodology and our articles are not intended to be financial advice. It does not constitute a recommendation to buy or sell any stock, and does not take account of your objectives, or your financial situation. We aim to bring you long-term focused analysis driven by fundamental data. Note that our analysis may not factor in the latest price-sensitive company announcements or qualitative material. Simply Wall St has no position in any stocks mentioned.
About TSE:1959
Kyudenko
Engages in design, construction, and installation of power infrastructure construction business in Japan.
Flawless balance sheet, good value and pays a dividend.
Market Insights

Advertisement
Community Narratives
WhiteCap Is Positioned To Profit Regardless Of Trump's Policy 
Fair Value CA$22.60|61.6% undervalued
ST
Equity Analyst and Writer
Microsoft's Evolution Will Drive Revenue to New Heights Fueled by AI
Fair Value US$360.00|28.6% overvalued
BR
Community Contributor
A CASE FOR USD$2.50 (CAD$3.44) BY 2028 (A 5-10 BAGGER)
Fair Value CA$3.44|87.5% undervalued
AG
Community Contributor