- Japan
- /
- Construction
- /
- TSE:1942
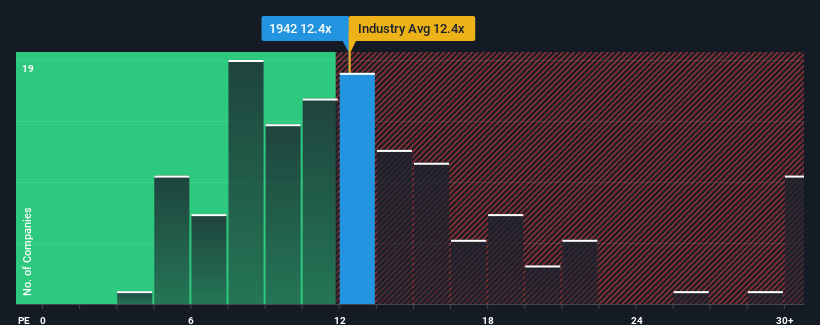
Kandenko Co.,Ltd.'s (TSE:1942) Business Is Trailing The Market But Its Shares Aren't


It's not a stretch to say that Kandenko Co.,Ltd.'s (TSE:1942) price-to-earnings (or "P/E") ratio of 12.4x right now seems quite "middle-of-the-road" compared to the market in Japan, where the median P/E ratio is around 14x. While this might not raise any eyebrows, if the P/E ratio is not justified investors could be missing out on a potential opportunity or ignoring looming disappointment.
With earnings growth that's superior to most other companies of late, KandenkoLtd has been doing relatively well. One possibility is that the P/E is moderate because investors think this strong earnings performance might be about to tail off. If you like the company, you'd be hoping this isn't the case so that you could potentially pick up some stock while it's not quite in favour.
Check out our latest analysis for KandenkoLtd
How Is KandenkoLtd's Growth Trending?
There's an inherent assumption that a company should be matching the market for P/E ratios like KandenkoLtd's to be considered reasonable.
Taking a look back first, we see that the company grew earnings per share by an impressive 29% last year. Pleasingly, EPS has also lifted 36% in aggregate from three years ago, thanks to the last 12 months of growth. So we can start by confirming that the company has done a great job of growing earnings over that time.
Looking ahead now, EPS is anticipated to climb by 4.2% per annum during the coming three years according to the five analysts following the company. Meanwhile, the rest of the market is forecast to expand by 9.6% per annum, which is noticeably more attractive.
In light of this, it's curious that KandenkoLtd's P/E sits in line with the majority of other companies. Apparently many investors in the company are less bearish than analysts indicate and aren't willing to let go of their stock right now. These shareholders may be setting themselves up for future disappointment if the P/E falls to levels more in line with the growth outlook.
The Bottom Line On KandenkoLtd's P/E
Typically, we'd caution against reading too much into price-to-earnings ratios when settling on investment decisions, though it can reveal plenty about what other market participants think about the company.
We've established that KandenkoLtd currently trades on a higher than expected P/E since its forecast growth is lower than the wider market. When we see a weak earnings outlook with slower than market growth, we suspect the share price is at risk of declining, sending the moderate P/E lower. This places shareholders' investments at risk and potential investors in danger of paying an unnecessary premium.
Before you take the next step, you should know about the 1 warning sign for KandenkoLtd that we have uncovered.
Of course, you might find a fantastic investment by looking at a few good candidates. So take a peek at this free list of companies with a strong growth track record, trading on a low P/E.
If you're looking to trade KandenkoLtd, open an account with the lowest-cost platform trusted by professionals, Interactive Brokers.
With clients in over 200 countries and territories, and access to 160 markets, IBKR lets you trade stocks, options, futures, forex, bonds and funds from a single integrated account.
Enjoy no hidden fees, no account minimums, and FX conversion rates as low as 0.03%, far better than what most brokers offer.
Sponsored ContentValuation is complex, but we're here to simplify it.
Discover if KandenkoLtd might be undervalued or overvalued with our detailed analysis, featuring fair value estimates, potential risks, dividends, insider trades, and its financial condition.
Access Free AnalysisHave feedback on this article? Concerned about the content? Get in touch with us directly. Alternatively, email editorial-team (at) simplywallst.com.
This article by Simply Wall St is general in nature. We provide commentary based on historical data and analyst forecasts only using an unbiased methodology and our articles are not intended to be financial advice. It does not constitute a recommendation to buy or sell any stock, and does not take account of your objectives, or your financial situation. We aim to bring you long-term focused analysis driven by fundamental data. Note that our analysis may not factor in the latest price-sensitive company announcements or qualitative material. Simply Wall St has no position in any stocks mentioned.
Have feedback on this article? Concerned about the content? Get in touch with us directly. Alternatively, email editorial-team@simplywallst.com
About TSE:1942
Flawless balance sheet with solid track record and pays a dividend.
Market Insights

Community Narratives

