Advertisement
- Japan
- /
- Construction
- /
- TSE:1885
Are TOA Shares Still Attractive After 157% Surge Ahead of 2025?

Simply Wall St
Reviewed by Simply Wall St
If you’re eyeing TOA stock and wondering whether it’s time to buy, hold, or trim your position, you’re not alone. With impressive returns of 80.5% year-to-date and a staggering 157.3% over the past year, TOA has rewarded its faithful investors handsomely. In just the last month, the stock has risen 4.8%, though it did slip 1.4% this past week, which some attribute to sector-wide adjustments rather than company-specific issues. Looking further back, the stock has soared 311.5% in three years and a remarkable 531.6% over five years, turning early believers into serious winners.
Some of this momentum can be traced to upbeat investor sentiment around TOA’s role in recently shifting market dynamics, especially as investors increasingly value companies with resilient business models in fluctuating conditions. This tailwind seems to have prompted a reassessment of the stock’s risk-reward profile and helped to fuel its upward trajectory.
Of course, price action is just part of the story. If you’re a valuation-focused investor, you’ll want to dig deeper than headline returns. Our latest review puts TOA at a value score of 3, meaning the company is currently undervalued on 3 out of 6 key checks. This is a solid but not definitive signal. Next, we’ll break down exactly what’s behind those valuation metrics and how they might influence your decision. And stick around, because beyond the classic analysis, there’s an even smarter perspective to consider when assessing TOA’s true worth.
TOA delivered 157.3% returns over the last year. See how this stacks up to the rest of the Construction industry.Approach 1: TOA Discounted Cash Flow (DCF) Analysis
The Discounted Cash Flow (DCF) model estimates a company's intrinsic value by taking its projected future cash flows and discounting them back to today's value. This gives investors a sense of what the company is worth, based entirely on expected future financial performance.
For TOA, the most recent twelve months saw negative Free Cash Flow (FCF) of approximately ¥17.48 billion. Looking ahead, analysts expect FCF to rebound to ¥14.2 billion in 2026 and then ¥15.3 billion in 2027. Projections beyond five years, such as an estimated ¥7.93 billion in 2035, are extrapolated from analyst models rather than guided by direct forecasts. As a result, they contain more uncertainty.
Running these cash flow projections through the DCF approach gives an estimated intrinsic value of ¥1,762 per share. However, this is 23.9% below the company’s current share price, implying that TOA is currently trading above what the DCF model suggests is fair value. The bottom line, based strictly on future free cash flows, is that the stock appears overvalued at this time.
Result: OVERVALUED
Head to the Valuation section of our Company Report for more details on how we arrive at this Fair Value for TOA.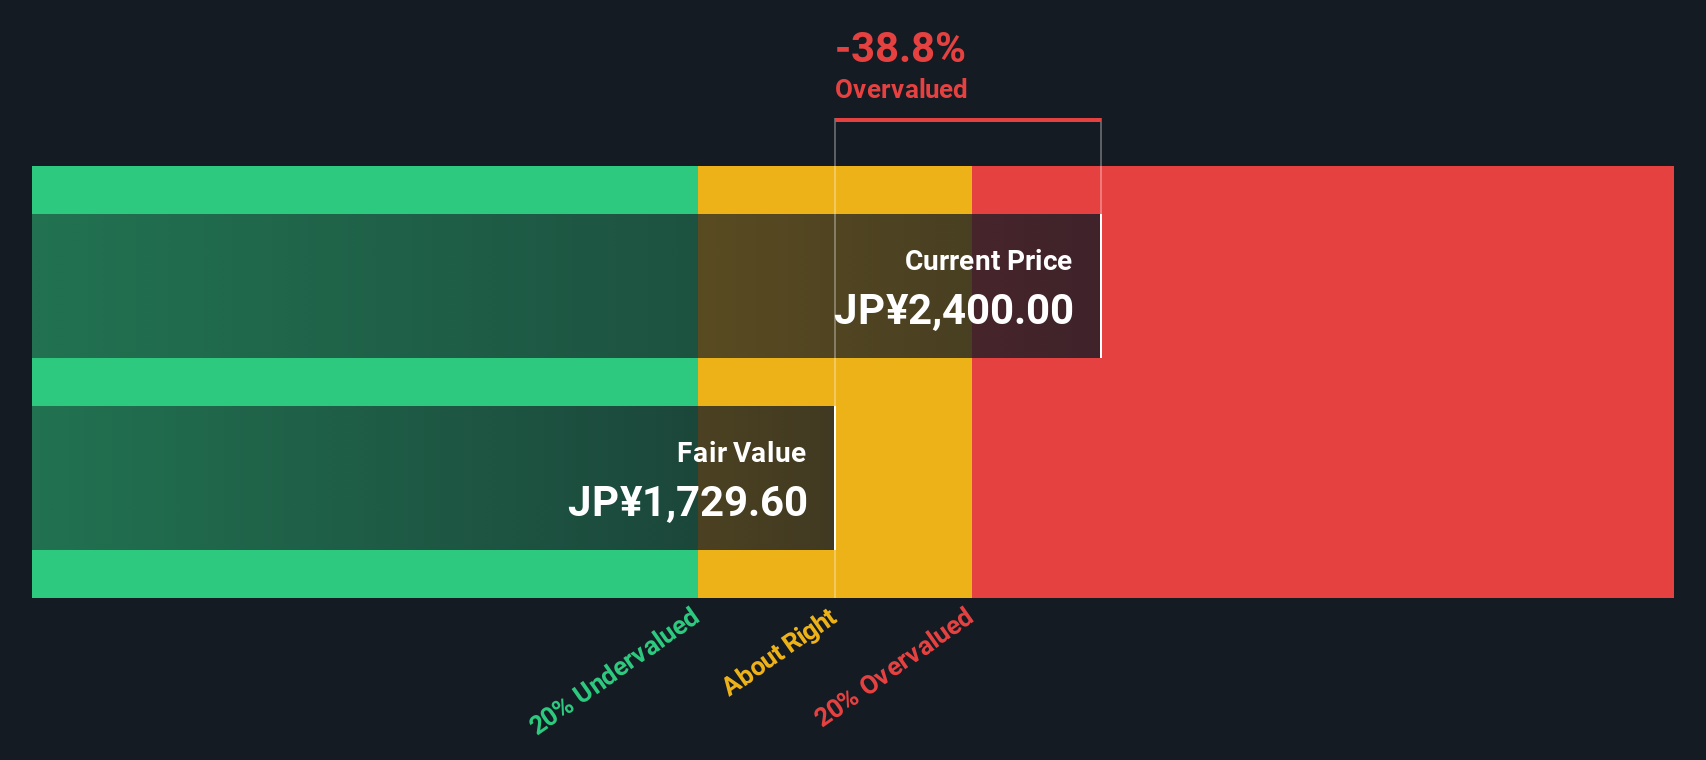
Approach 2: TOA Price vs Earnings
For profitable companies like TOA, the Price-to-Earnings (PE) ratio is a practical valuation tool because it shows how much investors are willing to pay for each unit of earnings. The PE ratio helps signal whether a stock is relatively cheap or expensive compared to its profitability.
It is important to remember that what counts as a “fair” PE ratio depends on more than just profits. It also factors in expected earnings growth, stability, and business risks. Generally, faster-growing companies with high predictability and low risk command higher PE multiples, while those with slower growth or more uncertainty tend to trade at lower multiples.
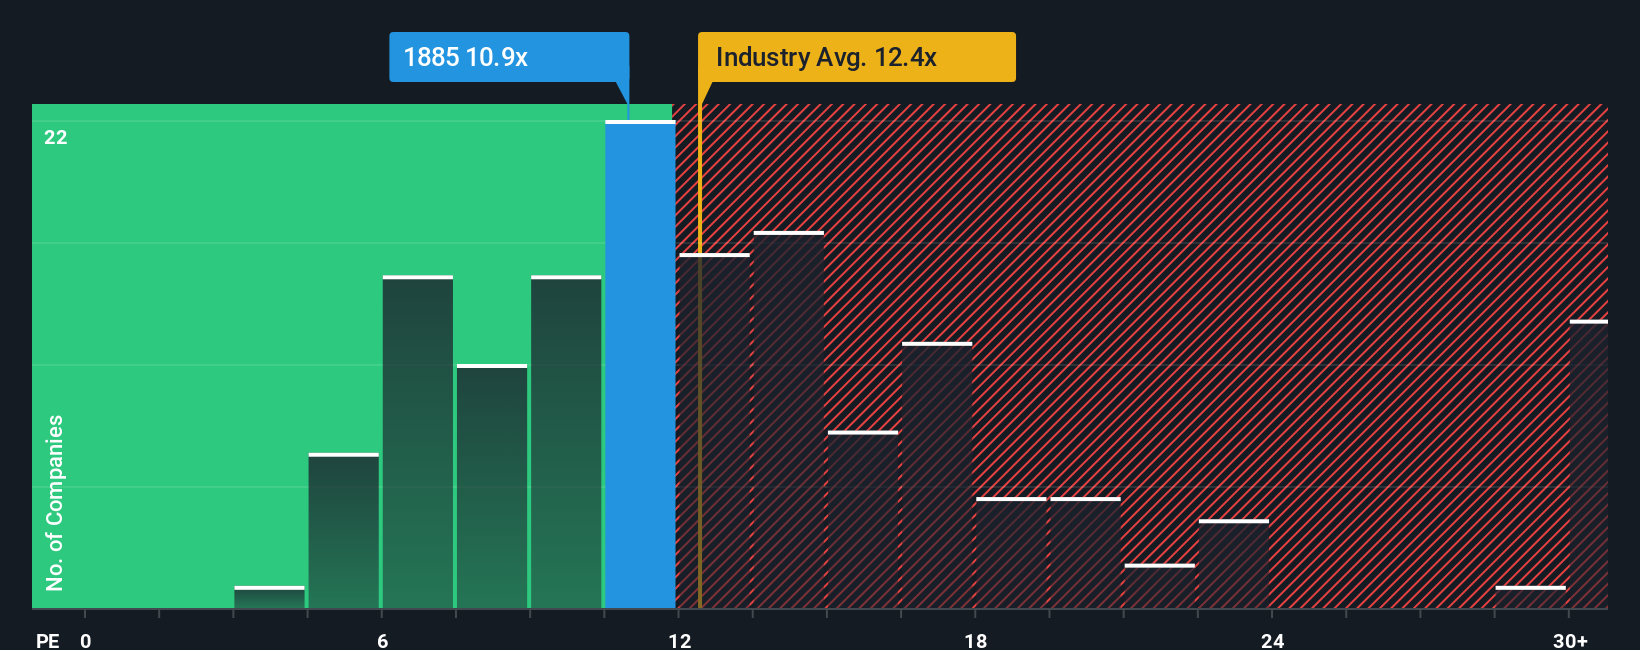
TOA currently trades at a PE of 10x, substantially below both its peer average of 18.6x and the Construction industry average of 12.7x. While peer and industry comparisons give a helpful snapshot, they do not account for TOA’s unique growth outlook, profitability, risk profile, or market cap.
This is where Simply Wall St’s proprietary “Fair Ratio” comes in. The Fair Ratio is a preferred multiple calculated using a blend of company-specific factors like earnings growth potential, profit margins, market risk, industry position, and market cap. Unlike raw industry or peer averages, the Fair Ratio offers a more tailored assessment of what would be a reasonable PE for TOA.
For TOA, the Fair Ratio is 12.67x. Since the current PE of 10x is just moderately lower than this fair value estimate and the gap is small enough to be considered immaterial by valuation standards, the analysis points to TOA trading at about the right valuation based on earnings.
Result: ABOUT RIGHT
Upgrade Your Decision Making: Choose your TOA Narrative
Earlier we mentioned that there is an even better way to understand valuation, so let's introduce you to Narratives. A Narrative is your own story about a company, your perspective on what drives its future, connecting personal assumptions about fair value, expected growth, and profit margins to a clear financial forecast and a target price. Narratives bridge the gap between a company’s story and its numbers, making insights actionable and helping you understand not just what TOA is worth, but why.
On Simply Wall St’s platform, millions of investors use Narratives every day, easily available in the Community page, to shape their buy or sell decisions by comparing their Fair Value estimates with the current share price. Narratives update automatically as major news, earnings results, or fresh data come in, meaning your analysis evolves just as quickly as the company’s outlook. For example, right now investor Narratives for TOA range widely, with some forecasting much higher future value based on rapid infrastructure growth, while others are more conservative, expecting only modest gains. Whatever your view, Narratives turn your insights into a quantified investment plan, bringing clarity and confidence to every decision.
Do you think there's more to the story for TOA? Create your own Narrative to let the Community know!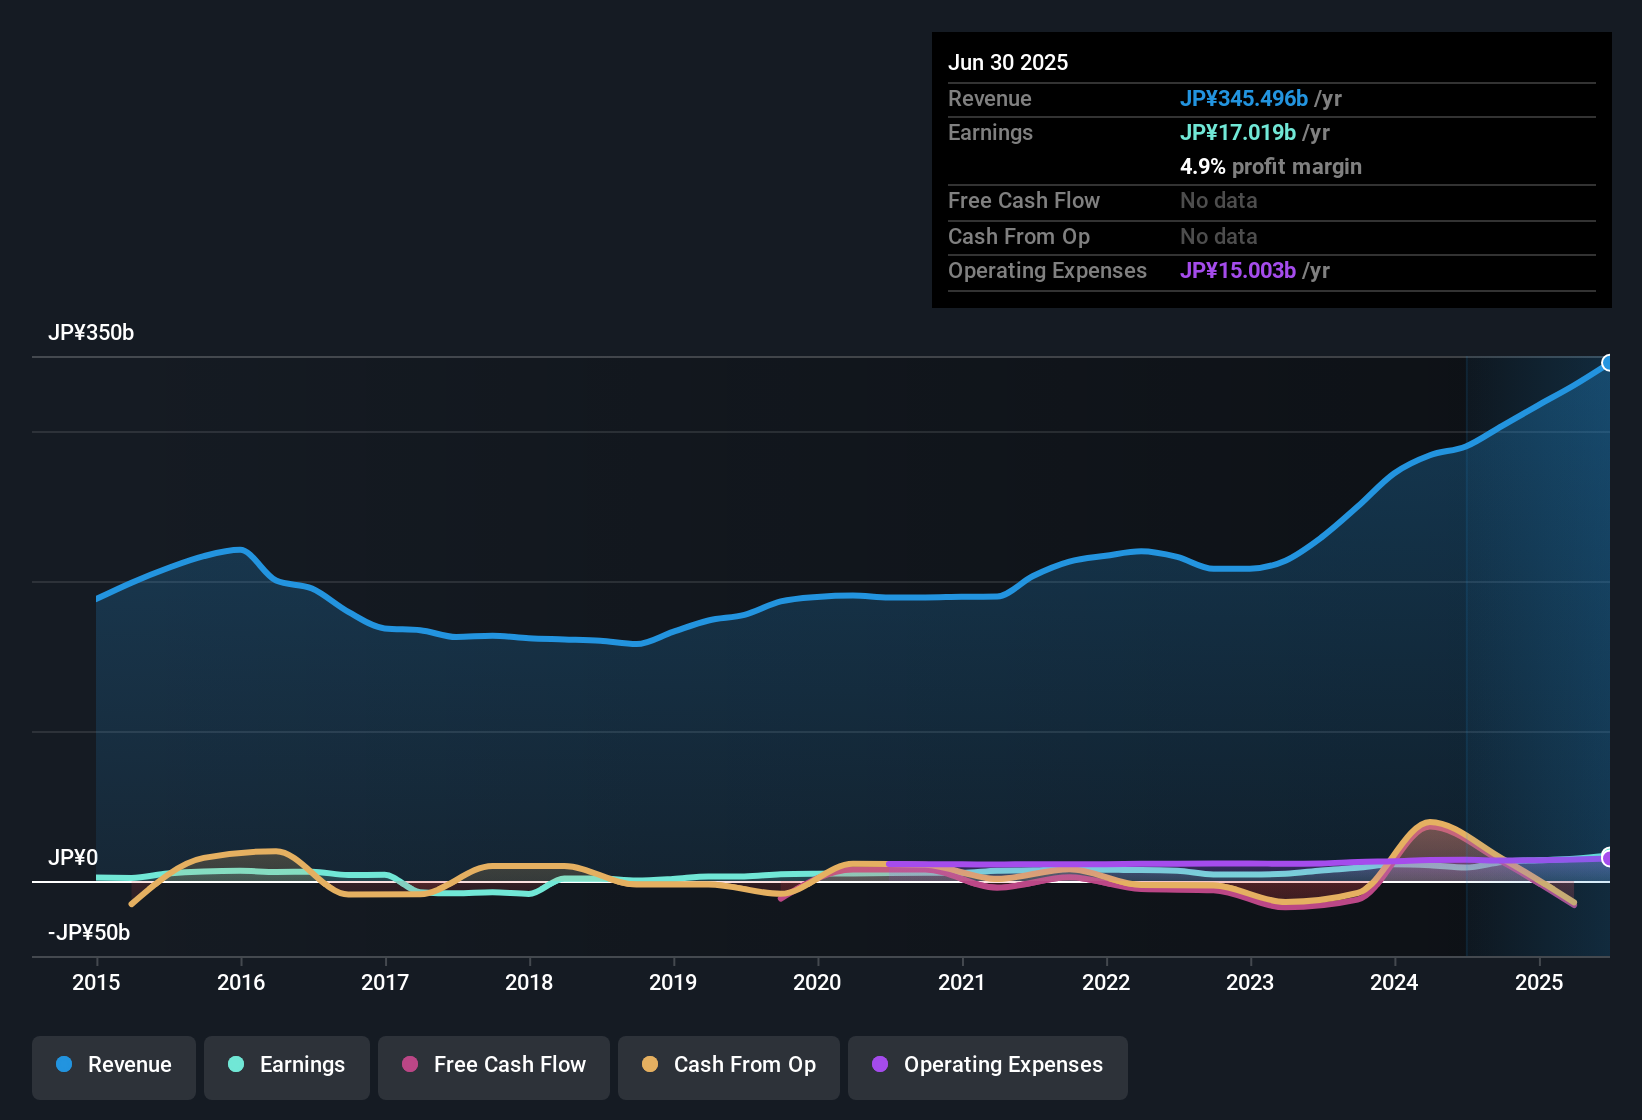
This article by Simply Wall St is general in nature. We provide commentary based on historical data and analyst forecasts only using an unbiased methodology and our articles are not intended to be financial advice. It does not constitute a recommendation to buy or sell any stock, and does not take account of your objectives, or your financial situation. We aim to bring you long-term focused analysis driven by fundamental data. Note that our analysis may not factor in the latest price-sensitive company announcements or qualitative material. Simply Wall St has no position in any stocks mentioned.
Valuation is complex, but we're here to simplify it.
Discover if TOA might be undervalued or overvalued with our detailed analysis, featuring fair value estimates, potential risks, dividends, insider trades, and its financial condition.
Access Free AnalysisHave feedback on this article? Concerned about the content? Get in touch with us directly. Alternatively, email editorial-team@simplywallst.com
About TSE:1885
Solid track record with excellent balance sheet.
Market Insights

Advertisement
Community Narratives
Kodiak AI - a potential 100 bagger opportunity?
Fair Value US$14.00|44.7% undervalued
DA
Community Contributor
A Fair Price for a Great Business Facing Real Threats
Fair Value US$383.06|13.0% undervalued
IM
Community Contributor
AXON And Shopify Integration Will Unlock Global Mobile Advertising
Fair Value US$646.30|0% overvalued
AN
Based on Analyst Price Targets