
Advertisement

What underlying fundamental trends can indicate that a company might be in decline? More often than not, we'll see a declining return on capital employed (ROCE) and a declining amount of capital employed. This reveals that the company isn't compounding shareholder wealth because returns are falling and its net asset base is shrinking. So after we looked into Tekken (TSE:1815), the trends above didn't look too great.
What Is Return On Capital Employed (ROCE)?
For those who don't know, ROCE is a measure of a company's yearly pre-tax profit (its return), relative to the capital employed in the business. Analysts use this formula to calculate it for Tekken:
Return on Capital Employed = Earnings Before Interest and Tax (EBIT) ÷ (Total Assets - Current Liabilities)
0.0087 = JP¥752m ÷ (JP¥236b - JP¥149b) (Based on the trailing twelve months to December 2023).
So, Tekken has an ROCE of 0.9%. Ultimately, that's a low return and it under-performs the Construction industry average of 7.6%.
See our latest analysis for Tekken
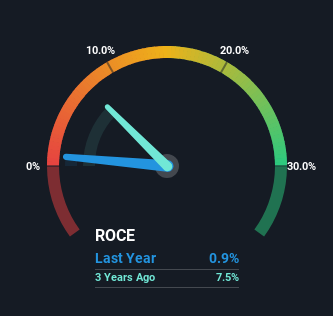
Historical performance is a great place to start when researching a stock so above you can see the gauge for Tekken's ROCE against it's prior returns. If you'd like to look at how Tekken has performed in the past in other metrics, you can view this free graph of Tekken's past earnings, revenue and cash flow.
What Can We Tell From Tekken's ROCE Trend?
In terms of Tekken's historical ROCE movements, the trend doesn't inspire confidence. To be more specific, the ROCE was 9.4% five years ago, but since then it has dropped noticeably. On top of that, it's worth noting that the amount of capital employed within the business has remained relatively steady. Since returns are falling and the business has the same amount of assets employed, this can suggest it's a mature business that hasn't had much growth in the last five years. If these trends continue, we wouldn't expect Tekken to turn into a multi-bagger.
On a separate but related note, it's important to know that Tekken has a current liabilities to total assets ratio of 63%, which we'd consider pretty high. This can bring about some risks because the company is basically operating with a rather large reliance on its suppliers or other sorts of short-term creditors. While it's not necessarily a bad thing, it can be beneficial if this ratio is lower.
What We Can Learn From Tekken's ROCE
In summary, it's unfortunate that Tekken is generating lower returns from the same amount of capital. Despite the concerning underlying trends, the stock has actually gained 22% over the last five years, so it might be that the investors are expecting the trends to reverse. Regardless, we don't like the trends as they are and if they persist, we think you might find better investments elsewhere.
One more thing: We've identified 4 warning signs with Tekken (at least 2 which shouldn't be ignored) , and understanding these would certainly be useful.
If you want to search for solid companies with great earnings, check out this free list of companies with good balance sheets and impressive returns on equity.
Valuation is complex, but we're here to simplify it.
Discover if Tekken might be undervalued or overvalued with our detailed analysis, featuring fair value estimates, potential risks, dividends, insider trades, and its financial condition.
Access Free AnalysisHave feedback on this article? Concerned about the content? Get in touch with us directly. Alternatively, email editorial-team (at) simplywallst.com.
This article by Simply Wall St is general in nature. We provide commentary based on historical data and analyst forecasts only using an unbiased methodology and our articles are not intended to be financial advice. It does not constitute a recommendation to buy or sell any stock, and does not take account of your objectives, or your financial situation. We aim to bring you long-term focused analysis driven by fundamental data. Note that our analysis may not factor in the latest price-sensitive company announcements or qualitative material. Simply Wall St has no position in any stocks mentioned.
About TSE:1815
Tekken
Engages in the construction business in Japan and internationally.
Established dividend payer slight.
Market Insights

Advertisement
Community Narratives
MicroStrategy: Volatile Gamble or Golden Opportunity?
Fair Value US$663.00|31.9% undervalued
BL
Community Contributor
Emerging Markets and Debt Reduction Will Propel Bath & Body Works Forward
Fair Value US$40.73|22.1% undervalued
ZW
Community Contributor
An amazing opportunity to potentially get a 100 bagger
Fair Value US$10.00|36.0% overvalued
DA
Community Contributor