
Advertisement

What trends should we look for it we want to identify stocks that can multiply in value over the long term? Amongst other things, we'll want to see two things; firstly, a growing return on capital employed (ROCE) and secondly, an expansion in the company's amount of capital employed. Ultimately, this demonstrates that it's a business that is reinvesting profits at increasing rates of return. Although, when we looked at Zenitaka (TSE:1811), it didn't seem to tick all of these boxes.
Understanding Return On Capital Employed (ROCE)
If you haven't worked with ROCE before, it measures the 'return' (pre-tax profit) a company generates from capital employed in its business. To calculate this metric for Zenitaka, this is the formula:
Return on Capital Employed = Earnings Before Interest and Tax (EBIT) ÷ (Total Assets - Current Liabilities)
0.026 = JP¥3.3b ÷ (JP¥195b - JP¥65b) (Based on the trailing twelve months to December 2024).
Thus, Zenitaka has an ROCE of 2.6%. In absolute terms, that's a low return and it also under-performs the Construction industry average of 8.9%.
Check out our latest analysis for Zenitaka
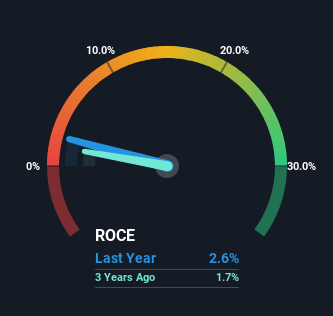
Historical performance is a great place to start when researching a stock so above you can see the gauge for Zenitaka's ROCE against it's prior returns. If you'd like to look at how Zenitaka has performed in the past in other metrics, you can view this free graph of Zenitaka's past earnings, revenue and cash flow .
The Trend Of ROCE
On the surface, the trend of ROCE at Zenitaka doesn't inspire confidence. Around five years ago the returns on capital were 5.9%, but since then they've fallen to 2.6%. Meanwhile, the business is utilizing more capital but this hasn't moved the needle much in terms of sales in the past 12 months, so this could reflect longer term investments. It may take some time before the company starts to see any change in earnings from these investments.
On a side note, Zenitaka has done well to pay down its current liabilities to 34% of total assets. So we could link some of this to the decrease in ROCE. What's more, this can reduce some aspects of risk to the business because now the company's suppliers or short-term creditors are funding less of its operations. Since the business is basically funding more of its operations with it's own money, you could argue this has made the business less efficient at generating ROCE.
The Bottom Line
In summary, Zenitaka is reinvesting funds back into the business for growth but unfortunately it looks like sales haven't increased much just yet. Additionally, the stock's total return to shareholders over the last five years has been flat, which isn't too surprising. All in all, the inherent trends aren't typical of multi-baggers, so if that's what you're after, we think you might have more luck elsewhere.
If you want to know some of the risks facing Zenitaka we've found 4 warning signs (1 is potentially serious!) that you should be aware of before investing here.
For those who like to invest in solid companies, check out this free list of companies with solid balance sheets and high returns on equity.
Valuation is complex, but we're here to simplify it.
Discover if Zenitaka might be undervalued or overvalued with our detailed analysis, featuring fair value estimates, potential risks, dividends, insider trades, and its financial condition.
Access Free AnalysisHave feedback on this article? Concerned about the content? Get in touch with us directly. Alternatively, email editorial-team (at) simplywallst.com.
This article by Simply Wall St is general in nature. We provide commentary based on historical data and analyst forecasts only using an unbiased methodology and our articles are not intended to be financial advice. It does not constitute a recommendation to buy or sell any stock, and does not take account of your objectives, or your financial situation. We aim to bring you long-term focused analysis driven by fundamental data. Note that our analysis may not factor in the latest price-sensitive company announcements or qualitative material. Simply Wall St has no position in any stocks mentioned.
About TSE:1811
Zenitaka
Provides general contracting services in Japan and internationally.
Adequate balance sheet slight.
Market Insights

Advertisement
Community Narratives
Groundbreaking therapies that could change the treatment landscape for PTSD, fibromyalgia, MS & Alzheimer’s
Fair Value US$6.20|86.9% undervalued
CM
Community Contributor
DigitalOcean Will Grow 14% by Embracing AI with Paperspace Acquisition
Fair Value US$50.00|42.8% undervalued
NE
Community Contributor
Viant Technology: A Rising AdTech Challenger in the AI-Powered CTV Market
Fair Value US$38.61|66.0% undervalued
BL
Community Contributor
Volvo will Accelerate Forward into Electric and Autonomous Leadership in Five Years
Fair Value SEK 438.80|40.8% undervalued
UN
Community Contributor