- Japan
- /
- Construction
- /
- TSE:1811
Statutory Profit Doesn't Reflect How Good Zenitaka's (TSE:1811) Earnings Are


When companies post strong earnings, the stock generally performs well, just like The Zenitaka Corporation's (TSE:1811) stock has recently. We did some digging and found some further encouraging factors that investors will like.
View our latest analysis for Zenitaka
A Closer Look At Zenitaka's Earnings
Many investors haven't heard of the accrual ratio from cashflow, but it is actually a useful measure of how well a company's profit is backed up by free cash flow (FCF) during a given period. To get the accrual ratio we first subtract FCF from profit for a period, and then divide that number by the average operating assets for the period. You could think of the accrual ratio from cashflow as the 'non-FCF profit ratio'.
As a result, a negative accrual ratio is a positive for the company, and a positive accrual ratio is a negative. While it's not a problem to have a positive accrual ratio, indicating a certain level of non-cash profits, a high accrual ratio is arguably a bad thing, because it indicates paper profits are not matched by cash flow. Notably, there is some academic evidence that suggests that a high accrual ratio is a bad sign for near-term profits, generally speaking.
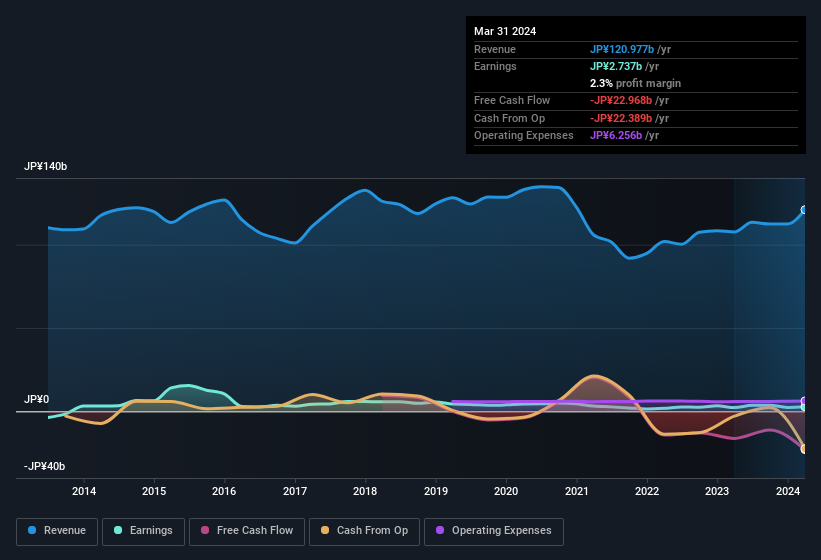
Zenitaka has an accrual ratio of 0.28 for the year to March 2024. We can therefore deduce that its free cash flow fell well short of covering its statutory profit. Even though it reported a profit of JP¥2.74b, a look at free cash flow indicates it actually burnt through JP¥23b in the last year. Coming off the back of negative free cash flow last year, we imagine some shareholders might wonder if its cash burn of JP¥23b, this year, indicates high risk. Having said that, there is more to the story. The accrual ratio is reflecting the impact of unusual items on statutory profit, at least in part.
Note: we always recommend investors check balance sheet strength. Click here to be taken to our balance sheet analysis of Zenitaka.
The Impact Of Unusual Items On Profit
Unfortunately (in the short term) Zenitaka saw its profit reduced by unusual items worth JP¥1.1b. In the case where this was a non-cash charge it would have made it easier to have high cash conversion, so it's surprising that the accrual ratio tells a different story. While deductions due to unusual items are disappointing in the first instance, there is a silver lining. When we analysed the vast majority of listed companies worldwide, we found that significant unusual items are often not repeated. And that's hardly a surprise given these line items are considered unusual. Assuming those unusual expenses don't come up again, we'd therefore expect Zenitaka to produce a higher profit next year, all else being equal.
Our Take On Zenitaka's Profit Performance
In conclusion, Zenitaka's accrual ratio suggests that its statutory earnings are not backed by cash flow, even though unusual items weighed on profit. Based on these factors, it's hard to tell if Zenitaka's profits are a reasonable reflection of its underlying profitability. Keep in mind, when it comes to analysing a stock it's worth noting the risks involved. For example, we've discovered 2 warning signs that you should run your eye over to get a better picture of Zenitaka.
Our examination of Zenitaka has focussed on certain factors that can make its earnings look better than they are. But there is always more to discover if you are capable of focussing your mind on minutiae. Some people consider a high return on equity to be a good sign of a quality business. While it might take a little research on your behalf, you may find this free collection of companies boasting high return on equity, or this list of stocks with significant insider holdings to be useful.
If you're looking to trade Zenitaka, open an account with the lowest-cost platform trusted by professionals, Interactive Brokers.
With clients in over 200 countries and territories, and access to 160 markets, IBKR lets you trade stocks, options, futures, forex, bonds and funds from a single integrated account.
Enjoy no hidden fees, no account minimums, and FX conversion rates as low as 0.03%, far better than what most brokers offer.
Sponsored ContentValuation is complex, but we're here to simplify it.
Discover if Zenitaka might be undervalued or overvalued with our detailed analysis, featuring fair value estimates, potential risks, dividends, insider trades, and its financial condition.
Access Free AnalysisHave feedback on this article? Concerned about the content? Get in touch with us directly. Alternatively, email editorial-team (at) simplywallst.com.
This article by Simply Wall St is general in nature. We provide commentary based on historical data and analyst forecasts only using an unbiased methodology and our articles are not intended to be financial advice. It does not constitute a recommendation to buy or sell any stock, and does not take account of your objectives, or your financial situation. We aim to bring you long-term focused analysis driven by fundamental data. Note that our analysis may not factor in the latest price-sensitive company announcements or qualitative material. Simply Wall St has no position in any stocks mentioned.
About TSE:1811
Zenitaka
Provides general contracting services in Japan and internationally.
Adequate balance sheet slight.
Market Insights

Community Narratives

