
Advertisement

Tobishima Corporation (TSE:1805) just reported some strong earnings, and the market reacted accordingly with a healthy uplift in the share price. However, our analysis suggests that shareholders may be missing some factors that indicate the earnings result was not as good as it looked.
See our latest analysis for Tobishima
Zooming In On Tobishima's Earnings
Many investors haven't heard of the accrual ratio from cashflow, but it is actually a useful measure of how well a company's profit is backed up by free cash flow (FCF) during a given period. The accrual ratio subtracts the FCF from the profit for a given period, and divides the result by the average operating assets of the company over that time. You could think of the accrual ratio from cashflow as the 'non-FCF profit ratio'.
That means a negative accrual ratio is a good thing, because it shows that the company is bringing in more free cash flow than its profit would suggest. That is not intended to imply we should worry about a positive accrual ratio, but it's worth noting where the accrual ratio is rather high. To quote a 2014 paper by Lewellen and Resutek, "firms with higher accruals tend to be less profitable in the future".
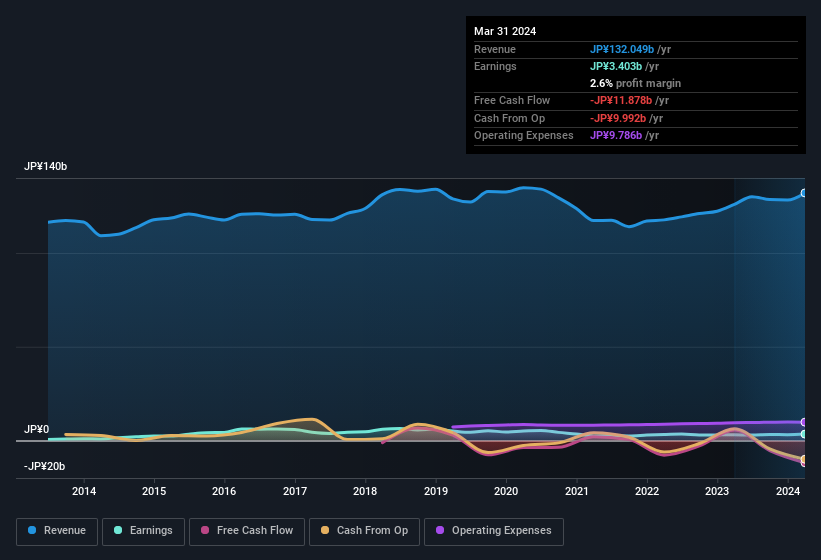
For the year to March 2024, Tobishima had an accrual ratio of 0.29. Therefore, we know that it's free cashflow was significantly lower than its statutory profit, raising questions about how useful that profit figure really is. In the last twelve months it actually had negative free cash flow, with an outflow of JP¥12b despite its profit of JP¥3.40b, mentioned above. It's worth noting that Tobishima generated positive FCF of JP¥5.6b a year ago, so at least they've done it in the past. One positive for Tobishima shareholders is that it's accrual ratio was significantly better last year, providing reason to believe that it may return to stronger cash conversion in the future. As a result, some shareholders may be looking for stronger cash conversion in the current year.
Note: we always recommend investors check balance sheet strength. Click here to be taken to our balance sheet analysis of Tobishima.
Our Take On Tobishima's Profit Performance
Tobishima's accrual ratio for the last twelve months signifies cash conversion is less than ideal, which is a negative when it comes to our view of its earnings. Because of this, we think that it may be that Tobishima's statutory profits are better than its underlying earnings power. Nonetheless, it's still worth noting that its earnings per share have grown at 39% over the last three years. Of course, we've only just scratched the surface when it comes to analysing its earnings; one could also consider margins, forecast growth, and return on investment, among other factors. In light of this, if you'd like to do more analysis on the company, it's vital to be informed of the risks involved. When we did our research, we found 3 warning signs for Tobishima (2 shouldn't be ignored!) that we believe deserve your full attention.
This note has only looked at a single factor that sheds light on the nature of Tobishima's profit. But there is always more to discover if you are capable of focussing your mind on minutiae. Some people consider a high return on equity to be a good sign of a quality business. While it might take a little research on your behalf, you may find this free collection of companies boasting high return on equity, or this list of stocks with significant insider holdings to be useful.
Valuation is complex, but we're here to simplify it.
Discover if TOBISHIMA HOLDINGS might be undervalued or overvalued with our detailed analysis, featuring fair value estimates, potential risks, dividends, insider trades, and its financial condition.
Access Free AnalysisHave feedback on this article? Concerned about the content? Get in touch with us directly. Alternatively, email editorial-team (at) simplywallst.com.
This article by Simply Wall St is general in nature. We provide commentary based on historical data and analyst forecasts only using an unbiased methodology and our articles are not intended to be financial advice. It does not constitute a recommendation to buy or sell any stock, and does not take account of your objectives, or your financial situation. We aim to bring you long-term focused analysis driven by fundamental data. Note that our analysis may not factor in the latest price-sensitive company announcements or qualitative material. Simply Wall St has no position in any stocks mentioned.
About TSE:256A
TOBISHIMA HOLDINGS
Engages in the construction business in Japan and internationally.
Proven track record with mediocre balance sheet.
Market Insights

Advertisement
Community Narratives
Groundbreaking therapies that could change the treatment landscape for PTSD, fibromyalgia, MS & Alzheimer’s
Fair Value US$6.20|86.9% undervalued
CM
Community Contributor
DigitalOcean Will Grow 14% by Embracing AI with Paperspace Acquisition
Fair Value US$50.00|42.8% undervalued
NE
Community Contributor
Viant Technology: A Rising AdTech Challenger in the AI-Powered CTV Market
Fair Value US$38.61|66.0% undervalued
BL
Community Contributor
Volvo will Accelerate Forward into Electric and Autonomous Leadership in Five Years
Fair Value SEK 438.80|40.1% undervalued
UN
Community Contributor