
Advertisement
- Japan
- /
- Trade Distributors
- /
- TSE:7635
If You Had Bought Sugita AceLtd (TYO:7635) Shares Five Years Ago You'd Have Earned 17% Returns

When you buy and hold a stock for the long term, you definitely want it to provide a positive return. But more than that, you probably want to see it rise more than the market average. But Sugita Ace Co.,Ltd. (TYO:7635) has fallen short of that second goal, with a share price rise of 17% over five years, which is below the market return. The last year has been disappointing, with the stock price down 9.8% in that time.
Check out our latest analysis for Sugita AceLtd
While markets are a powerful pricing mechanism, share prices reflect investor sentiment, not just underlying business performance. One flawed but reasonable way to assess how sentiment around a company has changed is to compare the earnings per share (EPS) with the share price.
During five years of share price growth, Sugita AceLtd actually saw its EPS drop 5.7% per year.
Since the EPS are down strongly, it seems highly unlikely market participants are looking at EPS to value the company. Given that EPS is down, but the share price is up, it seems clear the market is focussed on other aspects of the business, at the moment.
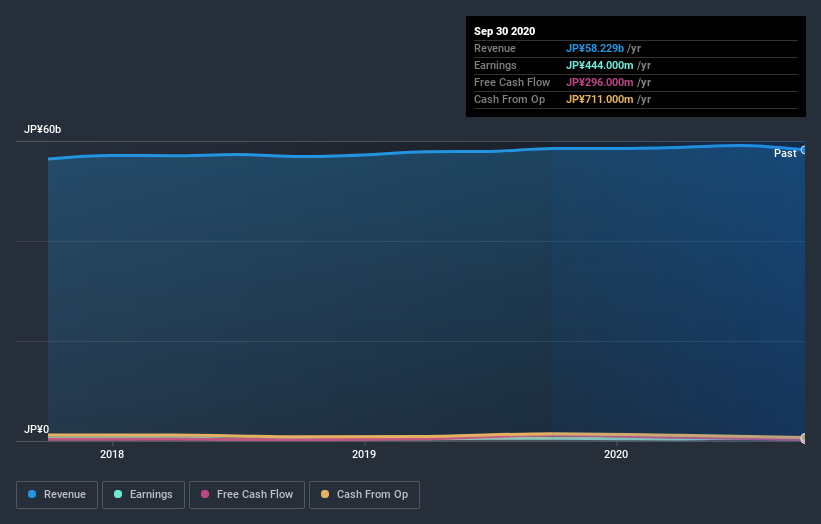
The revenue growth of 1.4% per year hardly seems impressive. So it seems one might have to take closer look at earnings and revenue trends to see how they might influence the share price.
The image below shows how earnings and revenue have tracked over time (if you click on the image you can see greater detail).
You can see how its balance sheet has strengthened (or weakened) over time in this free interactive graphic.
What About Dividends?
As well as measuring the share price return, investors should also consider the total shareholder return (TSR). The TSR incorporates the value of any spin-offs or discounted capital raisings, along with any dividends, based on the assumption that the dividends are reinvested. It's fair to say that the TSR gives a more complete picture for stocks that pay a dividend. We note that for Sugita AceLtd the TSR over the last 5 years was 34%, which is better than the share price return mentioned above. This is largely a result of its dividend payments!
A Different Perspective
Sugita AceLtd shareholders are down 7.1% for the year (even including dividends), but the market itself is up 8.8%. However, keep in mind that even the best stocks will sometimes underperform the market over a twelve month period. On the bright side, long term shareholders have made money, with a gain of 6% per year over half a decade. If the fundamental data continues to indicate long term sustainable growth, the current sell-off could be an opportunity worth considering. It's always interesting to track share price performance over the longer term. But to understand Sugita AceLtd better, we need to consider many other factors. Like risks, for instance. Every company has them, and we've spotted 2 warning signs for Sugita AceLtd (of which 1 can't be ignored!) you should know about.
If you are like me, then you will not want to miss this free list of growing companies that insiders are buying.
Please note, the market returns quoted in this article reflect the market weighted average returns of stocks that currently trade on JP exchanges.
When trading Sugita AceLtd or any other investment, use the platform considered by many to be the Professional's Gateway to the Worlds Market, Interactive Brokers. You get the lowest-cost* trading on stocks, options, futures, forex, bonds and funds worldwide from a single integrated account. Promoted
New: Manage All Your Stock Portfolios in One Place
We've created the ultimate portfolio companion for stock investors, and it's free.
• Connect an unlimited number of Portfolios and see your total in one currency
• Be alerted to new Warning Signs or Risks via email or mobile
• Track the Fair Value of your stocks
This article by Simply Wall St is general in nature. It does not constitute a recommendation to buy or sell any stock, and does not take account of your objectives, or your financial situation. We aim to bring you long-term focused analysis driven by fundamental data. Note that our analysis may not factor in the latest price-sensitive company announcements or qualitative material. Simply Wall St has no position in any stocks mentioned.
*Interactive Brokers Rated Lowest Cost Broker by StockBrokers.com Annual Online Review 2020
Have feedback on this article? Concerned about the content? Get in touch with us directly. Alternatively, email editorial-team (at) simplywallst.com.
About TSE:7635
Sugita AceLtd
Engages in the wholesale of building hardware and general building-related materials to hardware stores, building material trading companies, and metal contractors in Japan.
Excellent balance sheet established dividend payer.
Market Insights

Advertisement
Community Narratives
Groundbreaking therapies that could change the treatment landscape for PTSD, fibromyalgia, MS & Alzheimer’s
Fair Value US$6.20|86.9% undervalued
CM
Community Contributor
DigitalOcean Will Grow 14% by Embracing AI with Paperspace Acquisition
Fair Value US$50.00|41.7% undervalued
NE
Community Contributor
Viant Technology: A Rising AdTech Challenger in the AI-Powered CTV Market
Fair Value US$38.61|63.2% undervalued
BL
Community Contributor
Volvo will Accelerate Forward into Electric and Autonomous Leadership in Five Years
Fair Value SEK 438.80|39.7% undervalued
UN
Community Contributor