
Advertisement

Some say volatility, rather than debt, is the best way to think about risk as an investor, but Warren Buffett famously said that 'Volatility is far from synonymous with risk.' When we think about how risky a company is, we always like to look at its use of debt, since debt overload can lead to ruin. We note that Yamazaki Co., Ltd. (TYO:6147) does have debt on its balance sheet. But is this debt a concern to shareholders?
When Is Debt Dangerous?
Generally speaking, debt only becomes a real problem when a company can't easily pay it off, either by raising capital or with its own cash flow. Part and parcel of capitalism is the process of 'creative destruction' where failed businesses are mercilessly liquidated by their bankers. While that is not too common, we often do see indebted companies permanently diluting shareholders because lenders force them to raise capital at a distressed price. Of course, debt can be an important tool in businesses, particularly capital heavy businesses. The first step when considering a company's debt levels is to consider its cash and debt together.
See our latest analysis for Yamazaki
What Is Yamazaki's Debt?
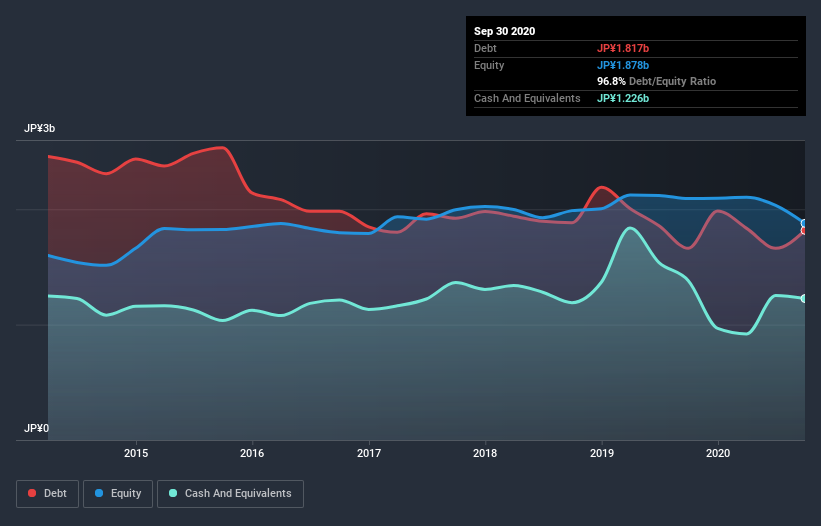
You can click the graphic below for the historical numbers, but it shows that as of September 2020 Yamazaki had JP¥1.82b of debt, an increase on JP¥1.66b, over one year. However, because it has a cash reserve of JP¥1.23b, its net debt is less, at about JP¥591.0m.
A Look At Yamazaki's Liabilities
The latest balance sheet data shows that Yamazaki had liabilities of JP¥1.86b due within a year, and liabilities of JP¥569.0m falling due after that. Offsetting these obligations, it had cash of JP¥1.23b as well as receivables valued at JP¥589.0m due within 12 months. So it has liabilities totalling JP¥616.0m more than its cash and near-term receivables, combined.
Yamazaki has a market capitalization of JP¥1.92b, so it could very likely raise cash to ameliorate its balance sheet, if the need arose. However, it is still worthwhile taking a close look at its ability to pay off debt. When analysing debt levels, the balance sheet is the obvious place to start. But you can't view debt in total isolation; since Yamazaki will need earnings to service that debt. So if you're keen to discover more about its earnings, it might be worth checking out this graph of its long term earnings trend.
In the last year Yamazaki had a loss before interest and tax, and actually shrunk its revenue by 8.2%, to JP¥3.2b. That's not what we would hope to see.
Caveat Emptor
Importantly, Yamazaki had an earnings before interest and tax (EBIT) loss over the last year. To be specific the EBIT loss came in at JP¥99m. Considering that alongside the liabilities mentioned above does not give us much confidence that company should be using so much debt. So we think its balance sheet is a little strained, though not beyond repair. Another cause for caution is that is bled JP¥162m in negative free cash flow over the last twelve months. So suffice it to say we consider the stock very risky. There's no doubt that we learn most about debt from the balance sheet. However, not all investment risk resides within the balance sheet - far from it. Be aware that Yamazaki is showing 4 warning signs in our investment analysis , and 2 of those shouldn't be ignored...
If, after all that, you're more interested in a fast growing company with a rock-solid balance sheet, then check out our list of net cash growth stocks without delay.
If you’re looking to trade Yamazaki, open an account with the lowest-cost* platform trusted by professionals, Interactive Brokers. Their clients from over 200 countries and territories trade stocks, options, futures, forex, bonds and funds worldwide from a single integrated account. Promoted
New: Manage All Your Stock Portfolios in One Place
We've created the ultimate portfolio companion for stock investors, and it's free.
• Connect an unlimited number of Portfolios and see your total in one currency
• Be alerted to new Warning Signs or Risks via email or mobile
• Track the Fair Value of your stocks
This article by Simply Wall St is general in nature. It does not constitute a recommendation to buy or sell any stock, and does not take account of your objectives, or your financial situation. We aim to bring you long-term focused analysis driven by fundamental data. Note that our analysis may not factor in the latest price-sensitive company announcements or qualitative material. Simply Wall St has no position in any stocks mentioned.
*Interactive Brokers Rated Lowest Cost Broker by StockBrokers.com Annual Online Review 2020
Have feedback on this article? Concerned about the content? Get in touch with us directly. Alternatively, email editorial-team (at) simplywallst.com.
About TSE:6147
Yamazaki
Manufactures and sells various machine tools in Japan and internationally.
Slight with acceptable track record.
Market Insights

Advertisement
Community Narratives
Groundbreaking therapies that could change the treatment landscape for PTSD, fibromyalgia, MS & Alzheimer’s
Fair Value US$6.20|86.9% undervalued
CM
Community Contributor
DigitalOcean Will Grow 14% by Embracing AI with Paperspace Acquisition
Fair Value US$50.00|41.7% undervalued
NE
Community Contributor
Viant Technology: A Rising AdTech Challenger in the AI-Powered CTV Market
Fair Value US$38.61|63.2% undervalued
BL
Community Contributor
Volvo will Accelerate Forward into Electric and Autonomous Leadership in Five Years
Fair Value SEK 438.80|39.7% undervalued
UN
Community Contributor