
Advertisement
- Japan
- /
- Trade Distributors
- /
- TSE:2761
Toshin Group Co.,Ltd.'s (TYO:2761) Financials Are Too Obscure To Link With Current Share Price Momentum: What's In Store For the Stock?
Most readers would already know that Toshin GroupLtd's (TYO:2761) stock increased by 6.2% over the past three months. However, we decided to study the company's mixed-bag of fundamentals to assess what this could mean for future share prices, as stock prices tend to be aligned with a company's long-term financial performance. Particularly, we will be paying attention to Toshin GroupLtd's ROE today.
Return on Equity or ROE is a test of how effectively a company is growing its value and managing investors’ money. Put another way, it reveals the company's success at turning shareholder investments into profits.
Check out our latest analysis for Toshin GroupLtd
How Do You Calculate Return On Equity?
ROE can be calculated by using the formula:
Return on Equity = Net Profit (from continuing operations) ÷ Shareholders' Equity
So, based on the above formula, the ROE for Toshin GroupLtd is:
3.9% = JP¥1.4b ÷ JP¥37b (Based on the trailing twelve months to November 2020).
The 'return' is the profit over the last twelve months. One way to conceptualize this is that for each ¥1 of shareholders' capital it has, the company made ¥0.04 in profit.
What Has ROE Got To Do With Earnings Growth?
So far, we've learned that ROE is a measure of a company's profitability. Based on how much of its profits the company chooses to reinvest or "retain", we are then able to evaluate a company's future ability to generate profits. Generally speaking, other things being equal, firms with a high return on equity and profit retention, have a higher growth rate than firms that don’t share these attributes.
Toshin GroupLtd's Earnings Growth And 3.9% ROE
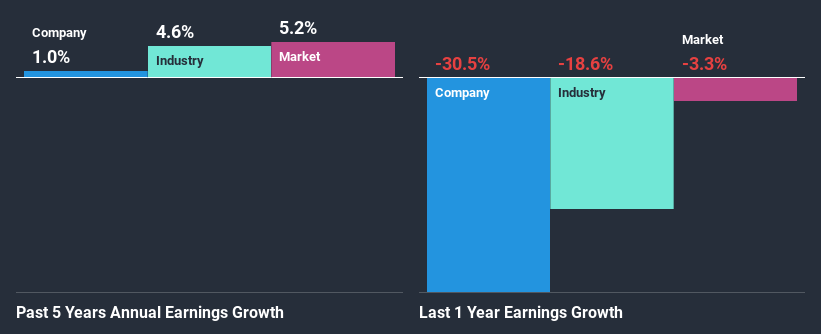
At first glance, Toshin GroupLtd's ROE doesn't look very promising. We then compared the company's ROE to the broader industry and were disappointed to see that the ROE is lower than the industry average of 5.9%. Therefore, Toshin GroupLtd's flat earnings over the past five years can possibly be explained by the low ROE amongst other factors.
Next, on comparing with the industry net income growth, we found that Toshin GroupLtd's reported growth was lower than the industry growth of 4.6% in the same period, which is not something we like to see.
Earnings growth is an important metric to consider when valuing a stock. What investors need to determine next is if the expected earnings growth, or the lack of it, is already built into the share price. This then helps them determine if the stock is placed for a bright or bleak future. One good indicator of expected earnings growth is the P/E ratio which determines the price the market is willing to pay for a stock based on its earnings prospects. So, you may want to check if Toshin GroupLtd is trading on a high P/E or a low P/E, relative to its industry.
Is Toshin GroupLtd Efficiently Re-investing Its Profits?
Toshin GroupLtd's low three-year median payout ratio of 23% (implying that the company keeps77% of its income) should mean that the company is retaining most of its earnings to fuel its growth and this should be reflected in its growth number, but that's not the case.
In addition, Toshin GroupLtd has been paying dividends over a period of at least ten years suggesting that keeping up dividend payments is way more important to the management even if it comes at the cost of business growth.
Conclusion
On the whole, we feel that the performance shown by Toshin GroupLtd can be open to many interpretations. While the company does have a high rate of reinvestment, the low ROE means that all that reinvestment is not reaping any benefit to its investors, and moreover, its having a negative impact on the earnings growth. Until now, we have only just grazed the surface of the company's past performance by looking at the company's fundamentals. So it may be worth checking this free detailed graph of Toshin GroupLtd's past earnings, as well as revenue and cash flows to get a deeper insight into the company's performance.
If you’re looking to trade Toshin GroupLtd, open an account with the lowest-cost* platform trusted by professionals, Interactive Brokers. Their clients from over 200 countries and territories trade stocks, options, futures, forex, bonds and funds worldwide from a single integrated account. Promoted
Valuation is complex, but we're here to simplify it.
Discover if Toshin Groupltd might be undervalued or overvalued with our detailed analysis, featuring fair value estimates, potential risks, dividends, insider trades, and its financial condition.
Access Free AnalysisThis article by Simply Wall St is general in nature. It does not constitute a recommendation to buy or sell any stock, and does not take account of your objectives, or your financial situation. We aim to bring you long-term focused analysis driven by fundamental data. Note that our analysis may not factor in the latest price-sensitive company announcements or qualitative material. Simply Wall St has no position in any stocks mentioned.
*Interactive Brokers Rated Lowest Cost Broker by StockBrokers.com Annual Online Review 2020
Have feedback on this article? Concerned about the content? Get in touch with us directly. Alternatively, email editorial-team (at) simplywallst.com.
About TSE:2761
Toshin Groupltd
Toshin Group co.,ltd. supplies electrical equipment and materials.
Flawless balance sheet with acceptable track record.
Market Insights

Advertisement
Community Narratives
MicroVision will explode future revenue by 380.37% with a vision towards success
Fair Value US$60.00|98.4% undervalued
TH
Community Contributor
The Indispensable Artery for a New North American Economy
Fair Value CA$132.87|1.3% undervalued
TI
Community Contributor