
Advertisement
- Japan
- /
- Auto Components
- /
- TSE:7318
Some Serendip Holdings Co.,Ltd. (TSE:7318) Shareholders Look For Exit As Shares Take 29% Pounding
Unfortunately for some shareholders, the Serendip Holdings Co.,Ltd. (TSE:7318) share price has dived 29% in the last thirty days, prolonging recent pain. Looking back over the past twelve months the stock has been a solid performer regardless, with a gain of 16%.
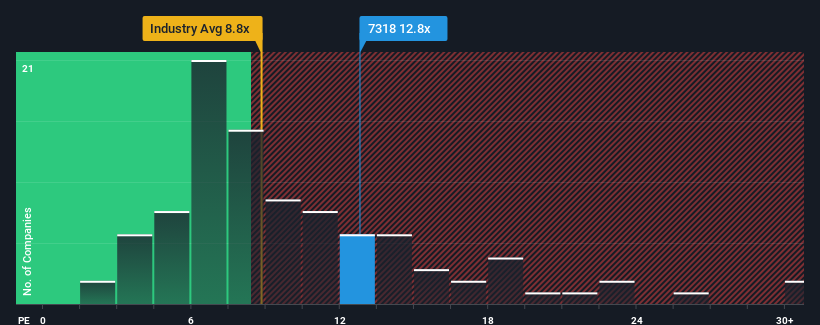
Although its price has dipped substantially, it's still not a stretch to say that Serendip HoldingsLtd's price-to-earnings (or "P/E") ratio of 12.8x right now seems quite "middle-of-the-road" compared to the market in Japan, where the median P/E ratio is around 14x. However, investors might be overlooking a clear opportunity or potential setback if there is no rational basis for the P/E.
Serendip HoldingsLtd certainly has been doing a great job lately as it's been growing earnings at a really rapid pace. The P/E is probably moderate because investors think this strong earnings growth might not be enough to outperform the broader market in the near future. If that doesn't eventuate, then existing shareholders have reason to be feeling optimistic about the future direction of the share price.
See our latest analysis for Serendip HoldingsLtd
How Is Serendip HoldingsLtd's Growth Trending?
Serendip HoldingsLtd's P/E ratio would be typical for a company that's only expected to deliver moderate growth, and importantly, perform in line with the market.
Taking a look back first, we see that the company grew earnings per share by an impressive 66% last year. Still, incredibly EPS has fallen 9.6% in total from three years ago, which is quite disappointing. So unfortunately, we have to acknowledge that the company has not done a great job of growing earnings over that time.
Comparing that to the market, which is predicted to deliver 9.8% growth in the next 12 months, the company's downward momentum based on recent medium-term earnings results is a sobering picture.
In light of this, it's somewhat alarming that Serendip HoldingsLtd's P/E sits in line with the majority of other companies. It seems most investors are ignoring the recent poor growth rate and are hoping for a turnaround in the company's business prospects. There's a good chance existing shareholders are setting themselves up for future disappointment if the P/E falls to levels more in line with the recent negative growth rates.
What We Can Learn From Serendip HoldingsLtd's P/E?
With its share price falling into a hole, the P/E for Serendip HoldingsLtd looks quite average now. Typically, we'd caution against reading too much into price-to-earnings ratios when settling on investment decisions, though it can reveal plenty about what other market participants think about the company.
We've established that Serendip HoldingsLtd currently trades on a higher than expected P/E since its recent earnings have been in decline over the medium-term. When we see earnings heading backwards and underperforming the market forecasts, we suspect the share price is at risk of declining, sending the moderate P/E lower. Unless the recent medium-term conditions improve, it's challenging to accept these prices as being reasonable.
It's always necessary to consider the ever-present spectre of investment risk. We've identified 4 warning signs with Serendip HoldingsLtd, and understanding these should be part of your investment process.
If these risks are making you reconsider your opinion on Serendip HoldingsLtd, explore our interactive list of high quality stocks to get an idea of what else is out there.
New: Manage All Your Stock Portfolios in One Place
We've created the ultimate portfolio companion for stock investors, and it's free.
• Connect an unlimited number of Portfolios and see your total in one currency
• Be alerted to new Warning Signs or Risks via email or mobile
• Track the Fair Value of your stocks
Have feedback on this article? Concerned about the content? Get in touch with us directly. Alternatively, email editorial-team (at) simplywallst.com.
This article by Simply Wall St is general in nature. We provide commentary based on historical data and analyst forecasts only using an unbiased methodology and our articles are not intended to be financial advice. It does not constitute a recommendation to buy or sell any stock, and does not take account of your objectives, or your financial situation. We aim to bring you long-term focused analysis driven by fundamental data. Note that our analysis may not factor in the latest price-sensitive company announcements or qualitative material. Simply Wall St has no position in any stocks mentioned.
About TSE:7318
Serendip HoldingsLtd
Operates business succession support, management consulting, M&A advisory, corporate revitalization support, corporate advisory, professional manager dispatch, and other incidental business in Japan.
Proven track record with adequate balance sheet.
Market Insights

Advertisement
Community Narratives
MicroVision will explode future revenue by 380.37% with a vision towards success
Fair Value US$60|98.4% undervalued
TH
Community Contributor
The Indispensable Artery for a New North American Economy
Fair Value CA$132.87|0.7% overvalued
TI
Community Contributor
Recently Updated Narratives
CO

composite32 on Astor Enerji ·
Astor Enerji will surge with a fair value of $140.43 in the next 3 years
Fair Value:₺140.4335.5% undervalued
1 followerusers have followed this narrative
0 commentsusers have commented on this narrative
0 likesusers have liked this narrative
RE

RecMag on Proximus ·
Proximus: The State-Backed Backup Plan with 7% Gross Yield and 15% Currency Upside.
Fair Value:€17.1356.7% undervalued
30 followersusers have followed this narrative
0 commentsusers have commented on this narrative
0 likesusers have liked this narrative
AG


Agricola on IMPACT Silver ·
A case for for IMPACT Silver Corp (TSXV:IPT) to reach USD $4.52 (CAD $6.16) in 2026 (23 bagger in 1 year) and USD $5.76 (CAD $7.89) by 2030
Fair Value:CA$7.8996.2% undervalued
1 followerusers have followed this narrative
0 commentsusers have commented on this narrative
0 likesusers have liked this narrative
Popular Narratives
TH

TheWallstreetKing on MicroVision ·
MicroVision will explode future revenue by 380.37% with a vision towards success
Fair Value:US$6098.4% undervalued
101 followersusers have followed this narrative
10 commentsusers have commented on this narrative
20 likesusers have liked this narrative
OS


oscargarcia on Alphabet ·
The company that turned a verb into a global necessity and basically runs the modern internet, digital ads, smartphones, maps, and AI.
Fair Value:US$3405.8% undervalued
139 followersusers have followed this narrative
6 commentsusers have commented on this narrative
18 likesusers have liked this narrative
AN


AnalystConsensusTarget on NVIDIA ·
NVDA: Expanding AI Demand Will Drive Major Data Center Investments Through 2026
Fair Value:US$250.3929.3% undervalued
931 followersusers have followed this narrative
6 commentsusers have commented on this narrative
23 likesusers have liked this narrative