Stock Analysis
Yamaha Motor Co., Ltd.'s (TSE:7272) Stock Been Rising: Are Strong Financials Guiding The Market?


Yamaha Motor's (TSE:7272) stock is up by 4.7% over the past three months. Given that the market rewards strong financials in the long-term, we wonder if that is the case in this instance. Particularly, we will be paying attention to Yamaha Motor's ROE today.
ROE or return on equity is a useful tool to assess how effectively a company can generate returns on the investment it received from its shareholders. Put another way, it reveals the company's success at turning shareholder investments into profits.
See our latest analysis for Yamaha Motor
How To Calculate Return On Equity?
The formula for ROE is:
Return on Equity = Net Profit (from continuing operations) ÷ Shareholders' Equity
So, based on the above formula, the ROE for Yamaha Motor is:
16% = JP¥191b ÷ JP¥1.2t (Based on the trailing twelve months to March 2024).
The 'return' is the profit over the last twelve months. That means that for every ¥1 worth of shareholders' equity, the company generated ¥0.16 in profit.
Why Is ROE Important For Earnings Growth?
So far, we've learned that ROE is a measure of a company's profitability. We now need to evaluate how much profit the company reinvests or "retains" for future growth which then gives us an idea about the growth potential of the company. Generally speaking, other things being equal, firms with a high return on equity and profit retention, have a higher growth rate than firms that don’t share these attributes.
Yamaha Motor's Earnings Growth And 16% ROE
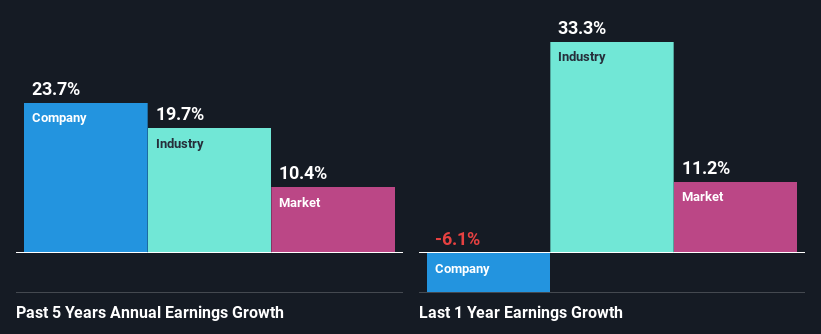
To start with, Yamaha Motor's ROE looks acceptable. Further, the company's ROE compares quite favorably to the industry average of 13%. Probably as a result of this, Yamaha Motor was able to see an impressive net income growth of 24% over the last five years. We believe that there might also be other aspects that are positively influencing the company's earnings growth. For example, it is possible that the company's management has made some good strategic decisions, or that the company has a low payout ratio.
We then compared Yamaha Motor's net income growth with the industry and we're pleased to see that the company's growth figure is higher when compared with the industry which has a growth rate of 20% in the same 5-year period.
Earnings growth is an important metric to consider when valuing a stock. What investors need to determine next is if the expected earnings growth, or the lack of it, is already built into the share price. By doing so, they will have an idea if the stock is headed into clear blue waters or if swampy waters await. If you're wondering about Yamaha Motor's's valuation, check out this gauge of its price-to-earnings ratio, as compared to its industry.
Is Yamaha Motor Making Efficient Use Of Its Profits?
The three-year median payout ratio for Yamaha Motor is 26%, which is moderately low. The company is retaining the remaining 74%. By the looks of it, the dividend is well covered and Yamaha Motor is reinvesting its profits efficiently as evidenced by its exceptional growth which we discussed above.
Additionally, Yamaha Motor has paid dividends over a period of at least ten years which means that the company is pretty serious about sharing its profits with shareholders.
Summary
In total, we are pretty happy with Yamaha Motor's performance. In particular, it's great to see that the company is investing heavily into its business and along with a high rate of return, that has resulted in a sizeable growth in its earnings. With that said, the latest industry analyst forecasts reveal that the company's earnings growth is expected to slow down. To know more about the latest analysts predictions for the company, check out this visualization of analyst forecasts for the company.
Valuation is complex, but we're helping make it simple.
Find out whether Yamaha Motor is potentially over or undervalued by checking out our comprehensive analysis, which includes fair value estimates, risks and warnings, dividends, insider transactions and financial health.
View the Free AnalysisHave feedback on this article? Concerned about the content? Get in touch with us directly. Alternatively, email editorial-team (at) simplywallst.com.
This article by Simply Wall St is general in nature. We provide commentary based on historical data and analyst forecasts only using an unbiased methodology and our articles are not intended to be financial advice. It does not constitute a recommendation to buy or sell any stock, and does not take account of your objectives, or your financial situation. We aim to bring you long-term focused analysis driven by fundamental data. Note that our analysis may not factor in the latest price-sensitive company announcements or qualitative material. Simply Wall St has no position in any stocks mentioned.
Valuation is complex, but we're helping make it simple.
Find out whether Yamaha Motor is potentially over or undervalued by checking out our comprehensive analysis, which includes fair value estimates, risks and warnings, dividends, insider transactions and financial health.
View the Free AnalysisHave feedback on this article? Concerned about the content? Get in touch with us directly. Alternatively, email editorial-team@simplywallst.com
About TSE:7272
Yamaha Motor
Engages in the land mobility, marine products, robotics, and financial services businesses in Japan, North America, Europe, Asia, and internationally.
Good value with mediocre balance sheet.
