Aisin (TSE:7259) shares have shown resilience over the past month, edging higher as investors weigh its steady revenue growth and consistent profitability. The company’s recent performance is sparking conversation about its value in the current market landscape.
Aisin’s share price momentum has really picked up in 2024, notching a 30.2% gain over the last quarter and soaring 46.4% year-to-date. For investors with a longer view, the 1-year total shareholder return of 62.5% and five-year return of 175.5% solidify Aisin’s reputation for steady performance and growing investor confidence.
If you’re tracking strength in the autos sector, now is a good time to explore other manufacturers with potential. See the full list for free.
But does this impressive rally suggest Aisin is still trading at an attractive valuation? Or have expectations for continued growth been fully baked into the price, leaving little upside for investors?
Advertisement
Price-to-Earnings of 14.3x: Is it justified?
Aisin’s stock trades at a price-to-earnings (P/E) ratio of 14.3x, which means investors are paying ¥2,594.5 for each ¥181.39 of annual earnings, a premium to many peers in the sector.
The price-to-earnings ratio measures how much investors are willing to pay today for each yen of current earnings. For auto component makers like Aisin, it is an important marker of market expectations for future profitability and growth prospects.
A P/E of 14.3x suggests the market sees relatively stable but not breakout earnings potential ahead. While this is cheaper than the peer average (15x), it is significantly higher than the industry average (11.3x), hinting at a blend of cautious optimism from investors. Notably, this multiple is also below the estimated fair price-to-earnings of 15.8x, which suggests there may be room for the market to reassess Aisin’s earnings power as trends evolve.
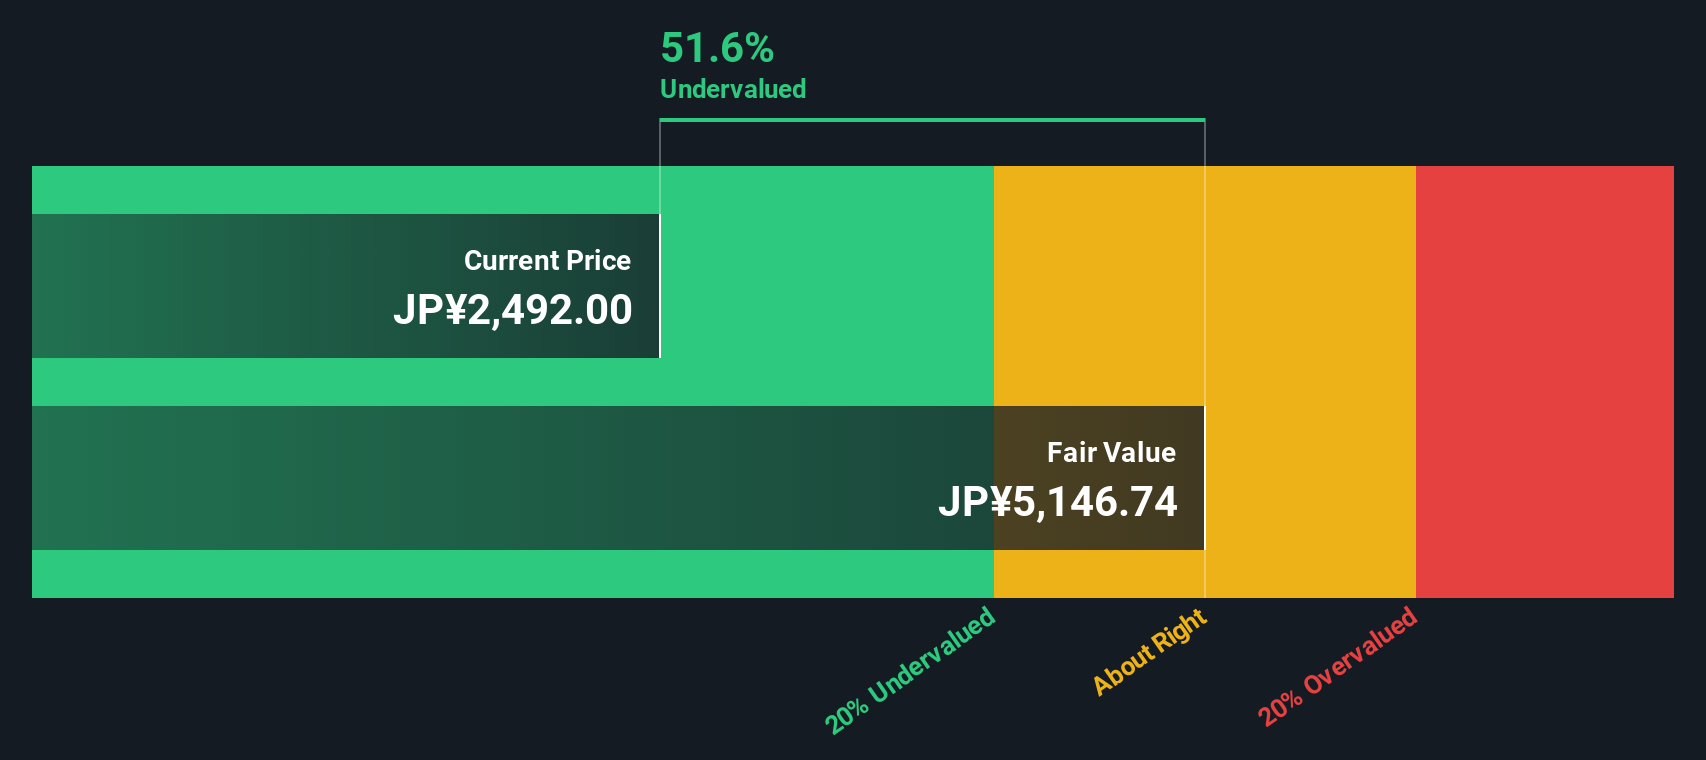
While the price-to-earnings ratio paints a picture of steady value, the SWS DCF model offers a different perspective. According to this method, Aisin is trading roughly 50% below its estimated fair value. This could indicate overlooked long-term potential.
Simply Wall St performs a discounted cash flow (DCF) on every stock in the world every day (check out Aisin for example). We show the entire calculation in full. You can track the result in your watchlist or portfolio and be alerted when this changes, or use our stock screener to discover undervalued stocks based on their cash flows. If you save a screener we even alert you when new companies match - so you never miss a potential opportunity.
Build Your Own Aisin Narrative
If you see things differently or want to dive deeper into the details, you can easily craft your own analysis in just a few minutes. Do it your way.
Grow your portfolio with confidence by tapping into fresh, data-driven stocks you might have missed. Let Simply Wall Street's powerful Screener transform your search and help you spot your next big opportunity before everyone else.
Tap into rapid growth opportunities by checking out these 26 AI penny stocks. These are driving innovation across industries from automation to cloud computing.
Boost your passive income and financial resilience by reviewing these 17 dividend stocks with yields > 3%, which offers consistently strong dividend yields above 3%.
This article by Simply Wall St is general in nature. We provide commentary based on historical data
and analyst forecasts only using an unbiased methodology and our articles are not intended to be financial advice. It does not constitute a recommendation to buy or sell any stock, and does not take account of your objectives, or your
financial situation. We aim to bring you long-term focused analysis driven by fundamental data.
Note that our analysis may not factor in the latest price-sensitive company announcements or qualitative material.
Simply Wall St has no position in any stocks mentioned.
New: Manage All Your Stock Portfolios in One Place
We've created the ultimate portfolio companion for stock investors, and it's free.
• Connect an unlimited number of Portfolios and see your total in one currency • Be alerted to new Warning Signs or Risks via email or mobile • Track the Fair Value of your stocks