
Advertisement
- Japan
- /
- Auto Components
- /
- TSE:6904
Returns On Capital Signal Difficult Times Ahead For Harada Industry (TSE:6904)

When researching a stock for investment, what can tell us that the company is in decline? A business that's potentially in decline often shows two trends, a return on capital employed (ROCE) that's declining, and a base of capital employed that's also declining. This indicates the company is producing less profit from its investments and its total assets are decreasing. So after we looked into Harada Industry (TSE:6904), the trends above didn't look too great.
Return On Capital Employed (ROCE): What Is It?
If you haven't worked with ROCE before, it measures the 'return' (pre-tax profit) a company generates from capital employed in its business. The formula for this calculation on Harada Industry is:
Return on Capital Employed = Earnings Before Interest and Tax (EBIT) ÷ (Total Assets - Current Liabilities)
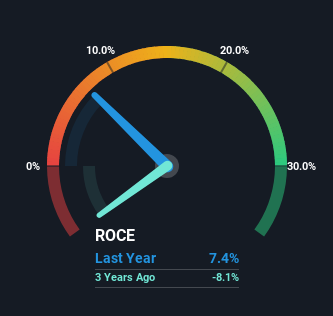
0.074 = JP¥1.0b ÷ (JP¥38b - JP¥24b) (Based on the trailing twelve months to March 2024).
Therefore, Harada Industry has an ROCE of 7.4%. Even though it's in line with the industry average of 6.5%, it's still a low return by itself.
See our latest analysis for Harada Industry
While the past is not representative of the future, it can be helpful to know how a company has performed historically, which is why we have this chart above. If you're interested in investigating Harada Industry's past further, check out this free graph covering Harada Industry's past earnings, revenue and cash flow.
What Does the ROCE Trend For Harada Industry Tell Us?
There is reason to be cautious about Harada Industry, given the returns are trending downwards. Unfortunately the returns on capital have diminished from the 11% that they were earning five years ago. On top of that, it's worth noting that the amount of capital employed within the business has remained relatively steady. This combination can be indicative of a mature business that still has areas to deploy capital, but the returns received aren't as high due potentially to new competition or smaller margins. So because these trends aren't typically conducive to creating a multi-bagger, we wouldn't hold our breath on Harada Industry becoming one if things continue as they have.
On a separate but related note, it's important to know that Harada Industry has a current liabilities to total assets ratio of 63%, which we'd consider pretty high. This can bring about some risks because the company is basically operating with a rather large reliance on its suppliers or other sorts of short-term creditors. While it's not necessarily a bad thing, it can be beneficial if this ratio is lower.
Our Take On Harada Industry's ROCE
All in all, the lower returns from the same amount of capital employed aren't exactly signs of a compounding machine. Investors haven't taken kindly to these developments, since the stock has declined 37% from where it was five years ago. Unless there is a shift to a more positive trajectory in these metrics, we would look elsewhere.
One final note, you should learn about the 3 warning signs we've spotted with Harada Industry (including 1 which can't be ignored) .
If you want to search for solid companies with great earnings, check out this free list of companies with good balance sheets and impressive returns on equity.
Valuation is complex, but we're here to simplify it.
Discover if Harada Industry might be undervalued or overvalued with our detailed analysis, featuring fair value estimates, potential risks, dividends, insider trades, and its financial condition.
Access Free AnalysisHave feedback on this article? Concerned about the content? Get in touch with us directly. Alternatively, email editorial-team (at) simplywallst.com.
This article by Simply Wall St is general in nature. We provide commentary based on historical data and analyst forecasts only using an unbiased methodology and our articles are not intended to be financial advice. It does not constitute a recommendation to buy or sell any stock, and does not take account of your objectives, or your financial situation. We aim to bring you long-term focused analysis driven by fundamental data. Note that our analysis may not factor in the latest price-sensitive company announcements or qualitative material. Simply Wall St has no position in any stocks mentioned.
Have feedback on this article? Concerned about the content? Get in touch with us directly. Alternatively, email editorial-team@simplywallst.com
About TSE:6904
Harada Industry
Engages in planning, design, development, manufacture, and sale of various automotive antennas for radio broadcasting, GPS, phone, DSRC, ETC, TV, and others in Japan and internationally.
Mediocre balance sheet low.
Market Insights


Advertisement
Community Narratives
MicroStrategy: Volatile Gamble or Golden Opportunity?
Fair Value US$663.00|33.3% undervalued
BL
Community Contributor
Emerging Markets and Debt Reduction Will Propel Bath & Body Works Forward
Fair Value US$40.73|23.4% undervalued
ZW
Community Contributor
An amazing opportunity to potentially get a 100 bagger
Fair Value US$10.00|8.5% overvalued
DA
Community Contributor