JTEKT (TSE:6473) shares closed up slightly in Tokyo, drawing attention from investors sizing up the stock’s performance over the past month and longer term. There has been steady interest as shares show a positive trajectory over the past year.
JTEKT’s share price has quietly gained momentum over the past year, with a 12-month total shareholder return of nearly 45%. This reflects renewed confidence and stronger fundamentals. The stock’s recent upward trend hints at potential growth and signals investor optimism as the broader sector evolves.
If JTEKT’s movement has you watching the auto space more closely, now could be the perfect time to explore fresh opportunities with See the full list for free.
But with shares already up strongly and fundamentals improving, is JTEKT still trading at an attractive valuation, or has the market priced in all the expected growth? Could this be a genuine buying opportunity or have expectations run ahead?
Advertisement
Price-to-Earnings of 50.3x: Is it justified?
JTEKT currently trades at a price-to-earnings (P/E) ratio of 50.3, which is significantly higher than peers in the auto components industry. This suggests the share price has moved well beyond typical valuations for the sector based on recent earnings.
The P/E ratio measures what investors are willing to pay for each yen of earnings. For auto component companies, a lower P/E often signals mature growth or cyclical stability. In contrast, a higher P/E can indicate the market expects strong profit growth ahead.
With JTEKT’s P/E at 50.3, the market is placing a premium on future earnings expectations. This level is sharply above the industry average of 11.1 and also higher than the estimated fair P/E of 35.5, signaling a potential disconnect between market excitement and fundamentals. If sentiment shifts or earnings disappoint, there is room for reversion toward the fair ratio considered justified for the sector.
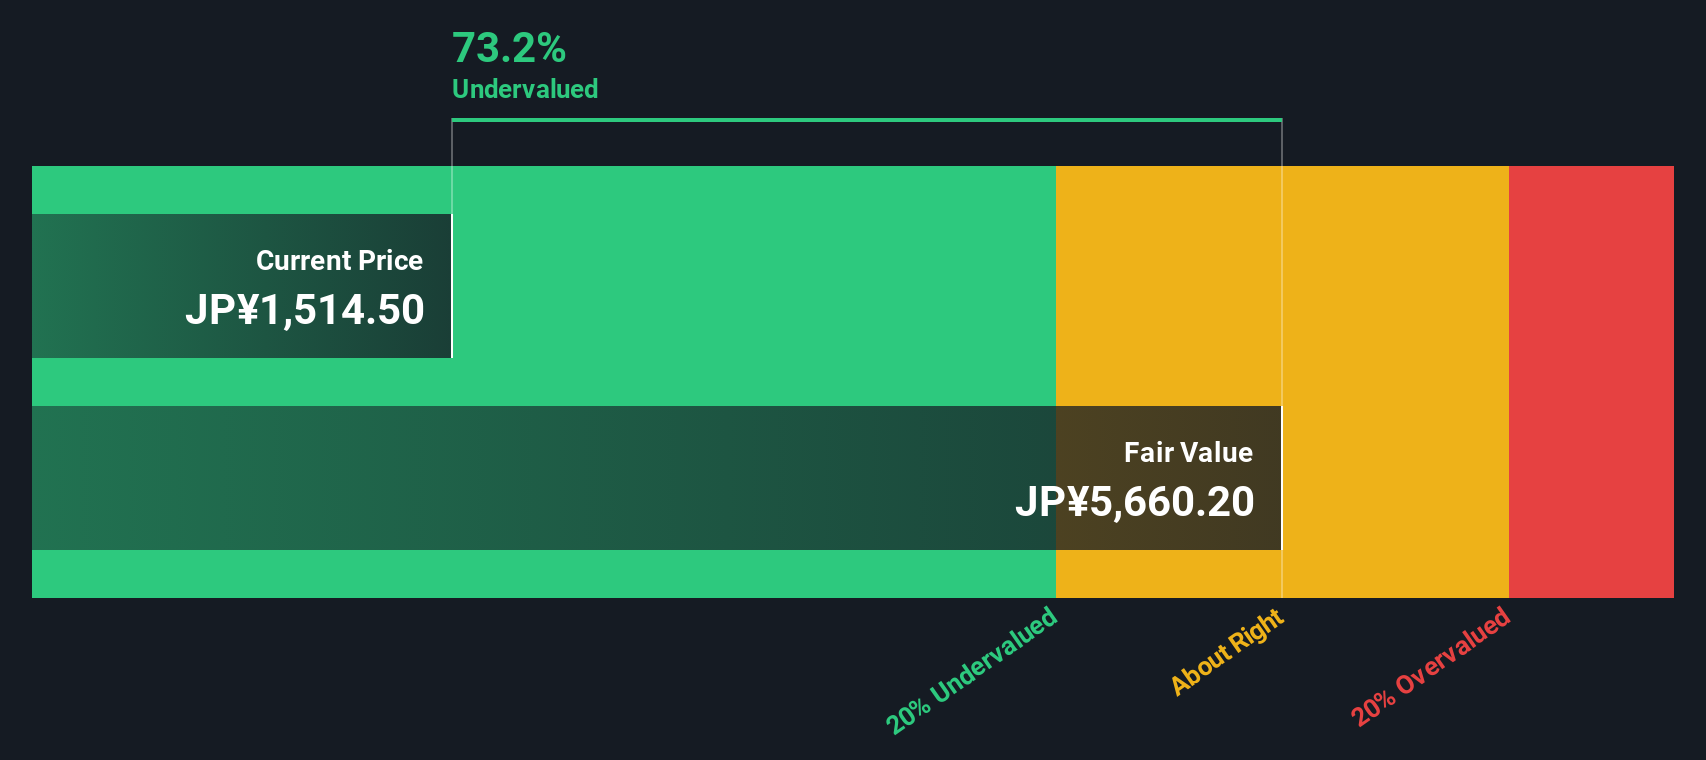
Another View: Discounted Cash Flow Paints a Different Picture
While the price-to-earnings ratio presents JTEKT as expensive compared to its peers, our DCF model takes a closer look at future cash flows. Surprisingly, it finds the stock trading around 70% below its estimated fair value, suggesting possible undervaluation. Could the market be overlooking something significant?
Simply Wall St performs a discounted cash flow (DCF) on every stock in the world every day (check out JTEKT for example). We show the entire calculation in full. You can track the result in your watchlist or portfolio and be alerted when this changes, or use our stock screener to discover undervalued stocks based on their cash flows. If you save a screener we even alert you when new companies match - so you never miss a potential opportunity.
Build Your Own JTEKT Narrative
Keep in mind that if you have a different perspective or want to dive deeper on your own, it only takes a few minutes to shape your own view. So why not Do it your way?
You don't want to miss the next breakout opportunity. Expand your search for stocks with strong upside by using the Simply Wall Street Screener. Make your next smart move today.
This article by Simply Wall St is general in nature. We provide commentary based on historical data
and analyst forecasts only using an unbiased methodology and our articles are not intended to be financial advice. It does not constitute a recommendation to buy or sell any stock, and does not take account of your objectives, or your
financial situation. We aim to bring you long-term focused analysis driven by fundamental data.
Note that our analysis may not factor in the latest price-sensitive company announcements or qualitative material.
Simply Wall St has no position in any stocks mentioned.
New: Manage All Your Stock Portfolios in One Place
We've created the ultimate portfolio companion for stock investors, and it's free.
• Connect an unlimited number of Portfolios and see your total in one currency • Be alerted to new Warning Signs or Risks via email or mobile • Track the Fair Value of your stocks