
Advertisement

Howard Marks put it nicely when he said that, rather than worrying about share price volatility, 'The possibility of permanent loss is the risk I worry about... and every practical investor I know worries about.' So it might be obvious that you need to consider debt, when you think about how risky any given stock is, because too much debt can sink a company. We can see that SNT Corporation (TSE:6319) does use debt in its business. But is this debt a concern to shareholders?
When Is Debt A Problem?
Debt is a tool to help businesses grow, but if a business is incapable of paying off its lenders, then it exists at their mercy. Part and parcel of capitalism is the process of 'creative destruction' where failed businesses are mercilessly liquidated by their bankers. However, a more usual (but still expensive) situation is where a company must dilute shareholders at a cheap share price simply to get debt under control. Of course, plenty of companies use debt to fund growth, without any negative consequences. The first step when considering a company's debt levels is to consider its cash and debt together.
Check out our latest analysis for SNT
How Much Debt Does SNT Carry?
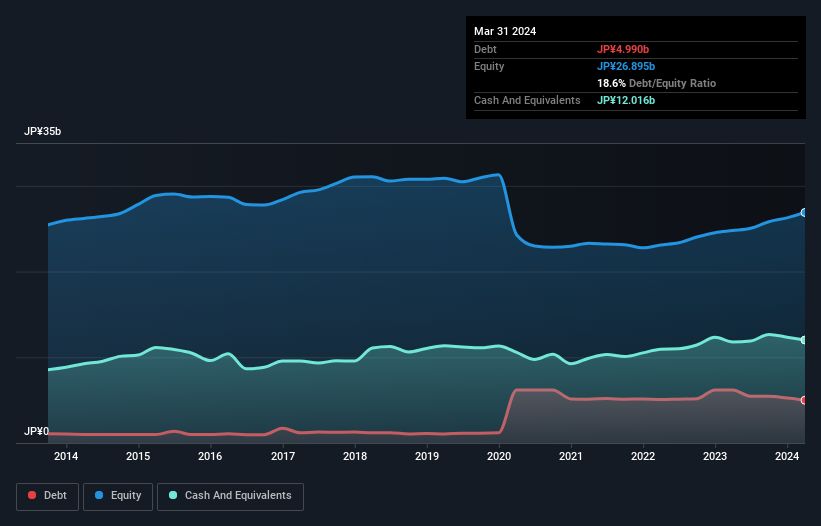
The image below, which you can click on for greater detail, shows that SNT had debt of JP¥4.99b at the end of March 2024, a reduction from JP¥6.19b over a year. But on the other hand it also has JP¥12.0b in cash, leading to a JP¥7.03b net cash position.
How Strong Is SNT's Balance Sheet?
The latest balance sheet data shows that SNT had liabilities of JP¥9.66b due within a year, and liabilities of JP¥2.32b falling due after that. On the other hand, it had cash of JP¥12.0b and JP¥4.83b worth of receivables due within a year. So it actually has JP¥4.87b more liquid assets than total liabilities.
This luscious liquidity implies that SNT's balance sheet is sturdy like a giant sequoia tree. With this in mind one could posit that its balance sheet means the company is able to handle some adversity. Simply put, the fact that SNT has more cash than debt is arguably a good indication that it can manage its debt safely.
On the other hand, SNT saw its EBIT drop by 9.8% in the last twelve months. That sort of decline, if sustained, will obviously make debt harder to handle. There's no doubt that we learn most about debt from the balance sheet. But it is SNT's earnings that will influence how the balance sheet holds up in the future. So if you're keen to discover more about its earnings, it might be worth checking out this graph of its long term earnings trend.
Finally, a company can only pay off debt with cold hard cash, not accounting profits. SNT may have net cash on the balance sheet, but it is still interesting to look at how well the business converts its earnings before interest and tax (EBIT) to free cash flow, because that will influence both its need for, and its capacity to manage debt. During the last three years, SNT produced sturdy free cash flow equating to 64% of its EBIT, about what we'd expect. This cold hard cash means it can reduce its debt when it wants to.
Summing Up
While it is always sensible to investigate a company's debt, in this case SNT has JP¥7.03b in net cash and a decent-looking balance sheet. So is SNT's debt a risk? It doesn't seem so to us. When analysing debt levels, the balance sheet is the obvious place to start. But ultimately, every company can contain risks that exist outside of the balance sheet. We've identified 2 warning signs with SNT , and understanding them should be part of your investment process.
When all is said and done, sometimes its easier to focus on companies that don't even need debt. Readers can access a list of growth stocks with zero net debt 100% free, right now.
New: Manage All Your Stock Portfolios in One Place
We've created the ultimate portfolio companion for stock investors, and it's free.
• Connect an unlimited number of Portfolios and see your total in one currency
• Be alerted to new Warning Signs or Risks via email or mobile
• Track the Fair Value of your stocks
Have feedback on this article? Concerned about the content? Get in touch with us directly. Alternatively, email editorial-team (at) simplywallst.com.
This article by Simply Wall St is general in nature. We provide commentary based on historical data and analyst forecasts only using an unbiased methodology and our articles are not intended to be financial advice. It does not constitute a recommendation to buy or sell any stock, and does not take account of your objectives, or your financial situation. We aim to bring you long-term focused analysis driven by fundamental data. Note that our analysis may not factor in the latest price-sensitive company announcements or qualitative material. Simply Wall St has no position in any stocks mentioned.
Have feedback on this article? Concerned about the content? Get in touch with us directly. Alternatively, email editorial-team@simplywallst.com
About TSE:6319
SNT
Manufactures and sells forging parts, scaffolding parts, and logistics equipment in Japan and internationally.
Excellent balance sheet average dividend payer.
Market Insights

Advertisement
Community Narratives
MicroStrategy: Volatile Gamble or Golden Opportunity?
Fair Value US$663.00|31.9% undervalued
BL
Community Contributor
Emerging Markets and Debt Reduction Will Propel Bath & Body Works Forward
Fair Value US$40.73|22.1% undervalued
ZW
Community Contributor
An amazing opportunity to potentially get a 100 bagger
Fair Value US$10.00|36.0% overvalued
DA
Community Contributor