- Japan
- /
- Auto Components
- /
- TSE:3526
Ashimori Industry (TSE:3526) Is Looking To Continue Growing Its Returns On Capital


If you're not sure where to start when looking for the next multi-bagger, there are a few key trends you should keep an eye out for. One common approach is to try and find a company with returns on capital employed (ROCE) that are increasing, in conjunction with a growing amount of capital employed. Put simply, these types of businesses are compounding machines, meaning they are continually reinvesting their earnings at ever-higher rates of return. With that in mind, we've noticed some promising trends at Ashimori Industry (TSE:3526) so let's look a bit deeper.
Return On Capital Employed (ROCE): What Is It?
For those who don't know, ROCE is a measure of a company's yearly pre-tax profit (its return), relative to the capital employed in the business. To calculate this metric for Ashimori Industry, this is the formula:
Return on Capital Employed = Earnings Before Interest and Tax (EBIT) ÷ (Total Assets - Current Liabilities)
0.13 = JP¥3.8b ÷ (JP¥54b - JP¥24b) (Based on the trailing twelve months to March 2024).
So, Ashimori Industry has an ROCE of 13%. In absolute terms, that's a satisfactory return, but compared to the Auto Components industry average of 6.5% it's much better.
See our latest analysis for Ashimori Industry
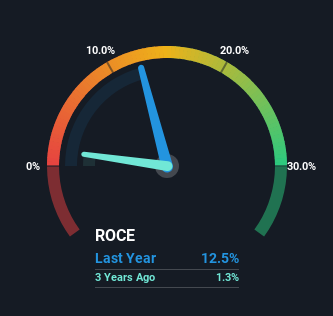
While the past is not representative of the future, it can be helpful to know how a company has performed historically, which is why we have this chart above. If you're interested in investigating Ashimori Industry's past further, check out this free graph covering Ashimori Industry's past earnings, revenue and cash flow.
So How Is Ashimori Industry's ROCE Trending?
Ashimori Industry has not disappointed with their ROCE growth. The figures show that over the last five years, ROCE has grown 44% whilst employing roughly the same amount of capital. Basically the business is generating higher returns from the same amount of capital and that is proof that there are improvements in the company's efficiencies. On that front, things are looking good so it's worth exploring what management has said about growth plans going forward.
On a separate but related note, it's important to know that Ashimori Industry has a current liabilities to total assets ratio of 44%, which we'd consider pretty high. This effectively means that suppliers (or short-term creditors) are funding a large portion of the business, so just be aware that this can introduce some elements of risk. Ideally we'd like to see this reduce as that would mean fewer obligations bearing risks.
Our Take On Ashimori Industry's ROCE
As discussed above, Ashimori Industry appears to be getting more proficient at generating returns since capital employed has remained flat but earnings (before interest and tax) are up. And with a respectable 46% awarded to those who held the stock over the last five years, you could argue that these developments are starting to get the attention they deserve. So given the stock has proven it has promising trends, it's worth researching the company further to see if these trends are likely to persist.
On a final note, we've found 2 warning signs for Ashimori Industry that we think you should be aware of.
While Ashimori Industry isn't earning the highest return, check out this free list of companies that are earning high returns on equity with solid balance sheets.
New: Manage All Your Stock Portfolios in One Place
We've created the ultimate portfolio companion for stock investors, and it's free.
• Connect an unlimited number of Portfolios and see your total in one currency
• Be alerted to new Warning Signs or Risks via email or mobile
• Track the Fair Value of your stocks
Have feedback on this article? Concerned about the content? Get in touch with us directly. Alternatively, email editorial-team (at) simplywallst.com.
This article by Simply Wall St is general in nature. We provide commentary based on historical data and analyst forecasts only using an unbiased methodology and our articles are not intended to be financial advice. It does not constitute a recommendation to buy or sell any stock, and does not take account of your objectives, or your financial situation. We aim to bring you long-term focused analysis driven by fundamental data. Note that our analysis may not factor in the latest price-sensitive company announcements or qualitative material. Simply Wall St has no position in any stocks mentioned.
Have feedback on this article? Concerned about the content? Get in touch with us directly. Alternatively, email editorial-team@simplywallst.com
About TSE:3526
Ashimori Industry
Manufactures and sells automotive safety systems in Japan and internationally.
Flawless balance sheet with proven track record and pays a dividend.

