

Some say volatility, rather than debt, is the best way to think about risk as an investor, but Warren Buffett famously said that 'Volatility is far from synonymous with risk.' When we think about how risky a company is, we always like to look at its use of debt, since debt overload can lead to ruin. As with many other companies Snam S.p.A. (BIT:SRG) makes use of debt. But the real question is whether this debt is making the company risky.
What Risk Does Debt Bring?
Debt and other liabilities become risky for a business when it cannot easily fulfill those obligations, either with free cash flow or by raising capital at an attractive price. If things get really bad, the lenders can take control of the business. However, a more frequent (but still costly) occurrence is where a company must issue shares at bargain-basement prices, permanently diluting shareholders, just to shore up its balance sheet. Having said that, the most common situation is where a company manages its debt reasonably well - and to its own advantage. The first thing to do when considering how much debt a business uses is to look at its cash and debt together.
See our latest analysis for Snam
What Is Snam's Debt?
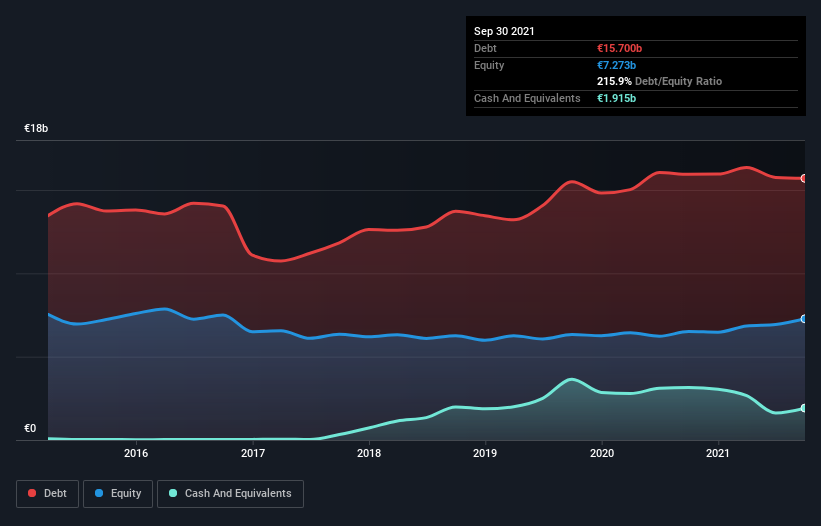
As you can see below, Snam had €15.7b of debt, at September 2021, which is about the same as the year before. You can click the chart for greater detail. On the flip side, it has €1.92b in cash leading to net debt of about €13.8b.
How Strong Is Snam's Balance Sheet?
The latest balance sheet data shows that Snam had liabilities of €5.76b due within a year, and liabilities of €10.2b falling due after that. On the other hand, it had cash of €1.92b and €2.01b worth of receivables due within a year. So its liabilities total €12.0b more than the combination of its cash and short-term receivables.
This deficit is considerable relative to its very significant market capitalization of €15.7b, so it does suggest shareholders should keep an eye on Snam's use of debt. This suggests shareholders would be heavily diluted if the company needed to shore up its balance sheet in a hurry.
We measure a company's debt load relative to its earnings power by looking at its net debt divided by its earnings before interest, tax, depreciation, and amortization (EBITDA) and by calculating how easily its earnings before interest and tax (EBIT) cover its interest expense (interest cover). The advantage of this approach is that we take into account both the absolute quantum of debt (with net debt to EBITDA) and the actual interest expenses associated with that debt (with its interest cover ratio).
Strangely Snam has a sky high EBITDA ratio of 6.2, implying high debt, but a strong interest coverage of 18.2. So either it has access to very cheap long term debt or that interest expense is going to grow! Importantly Snam's EBIT was essentially flat over the last twelve months. Ideally it can diminish its debt load by kick-starting earnings growth. The balance sheet is clearly the area to focus on when you are analysing debt. But ultimately the future profitability of the business will decide if Snam can strengthen its balance sheet over time. So if you want to see what the professionals think, you might find this free report on analyst profit forecasts to be interesting.
Finally, a company can only pay off debt with cold hard cash, not accounting profits. So we clearly need to look at whether that EBIT is leading to corresponding free cash flow. In the last three years, Snam's free cash flow amounted to 30% of its EBIT, less than we'd expect. That weak cash conversion makes it more difficult to handle indebtedness.
Our View
Snam's net debt to EBITDA and level of total liabilities definitely weigh on it, in our esteem. But the good news is it seems to be able to cover its interest expense with its EBIT with ease. We should also note that Gas Utilities industry companies like Snam commonly do use debt without problems. When we consider all the factors discussed, it seems to us that Snam is taking some risks with its use of debt. While that debt can boost returns, we think the company has enough leverage now. When analysing debt levels, the balance sheet is the obvious place to start. But ultimately, every company can contain risks that exist outside of the balance sheet. These risks can be hard to spot. Every company has them, and we've spotted 2 warning signs for Snam (of which 1 is potentially serious!) you should know about.
When all is said and done, sometimes its easier to focus on companies that don't even need debt. Readers can access a list of growth stocks with zero net debt 100% free, right now.
New: Manage All Your Stock Portfolios in One Place
We've created the ultimate portfolio companion for stock investors, and it's free.
• Connect an unlimited number of Portfolios and see your total in one currency
• Be alerted to new Warning Signs or Risks via email or mobile
• Track the Fair Value of your stocks
Have feedback on this article? Concerned about the content? Get in touch with us directly. Alternatively, email editorial-team (at) simplywallst.com.
This article by Simply Wall St is general in nature. We provide commentary based on historical data and analyst forecasts only using an unbiased methodology and our articles are not intended to be financial advice. It does not constitute a recommendation to buy or sell any stock, and does not take account of your objectives, or your financial situation. We aim to bring you long-term focused analysis driven by fundamental data. Note that our analysis may not factor in the latest price-sensitive company announcements or qualitative material. Simply Wall St has no position in any stocks mentioned.
About BIT:SRG
Snam
Engages in the operation of natural gas transport and storage infrastructure.
Proven track record average dividend payer.
Similar Companies
Market Insights

Community Narratives

