

Is Snam S.p.A. (BIT:SRG) a good dividend stock? How can we tell? Dividend paying companies with growing earnings can be highly rewarding in the long term. Unfortunately, it's common for investors to be enticed in by the seemingly attractive yield, and lose money when the company has to cut its dividend payments.
A high yield and a long history of paying dividends is an appealing combination for Snam. It would not be a surprise to discover that many investors buy it for the dividends. Some simple analysis can offer a lot of insights when buying a company for its dividend, and we'll go through this below.
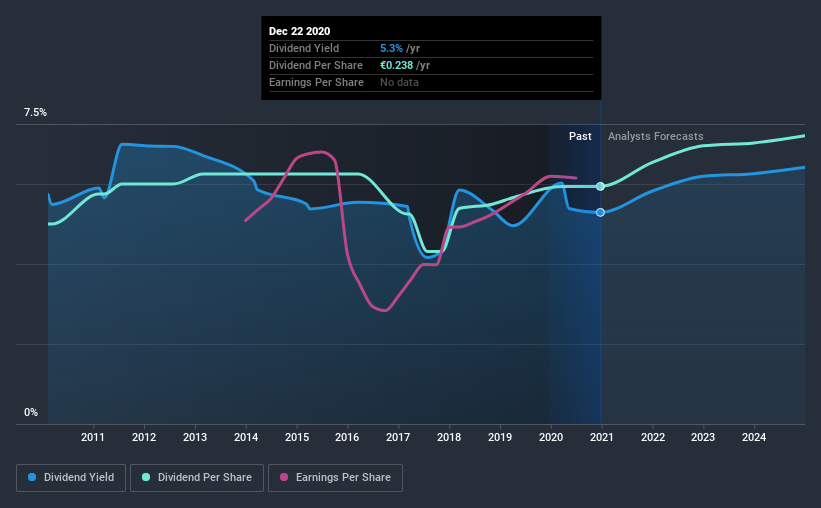
Explore this interactive chart for our latest analysis on Snam!
Payout ratios
Companies (usually) pay dividends out of their earnings. If a company is paying more than it earns, the dividend might have to be cut. As a result, we should always investigate whether a company can afford its dividend, measured as a percentage of a company's net income after tax. Looking at the data, we can see that 74% of Snam's profits were paid out as dividends in the last 12 months. This is a healthy payout ratio, and while it does limit the amount of earnings that can be reinvested in the business, there is also some room to lift the payout ratio over time.
In addition to comparing dividends against profits, we should inspect whether the company generated enough cash to pay its dividend. With a cash payout ratio of 126%, Snam's dividend payments are poorly covered by cash flow. Snam paid out less in dividends than it reported in profits, but unfortunately it didn't generate enough free cash flow to cover the dividend. Cash is king, as they say, and were Snam to repeatedly pay dividends that aren't well covered by cashflow, we would consider this a warning sign.
Consider getting our latest analysis on Snam's financial position here.
Dividend Volatility
From the perspective of an income investor who wants to earn dividends for many years, there is not much point buying a stock if its dividend is regularly cut or is not reliable. Snam has been paying dividends for a long time, but for the purpose of this analysis, we only examine the past 10 years of payments. This dividend has been unstable, which we define as having been cut one or more times over this time. During the past 10-year period, the first annual payment was €0.2 in 2010, compared to €0.2 last year. Dividends per share have grown at approximately 1.7% per year over this time. Snam's dividend payments have fluctuated, so it hasn't grown 1.7% every year, but the CAGR is a useful rule of thumb for approximating the historical growth.
We're glad to see the dividend has risen, but with a limited rate of growth and fluctuations in the payments, we don't think this is an attractive combination.
Dividend Growth Potential
Given that the dividend has been cut in the past, we need to check if earnings are growing and if that might lead to stronger dividends in the future. While there may be fluctuations in the past , Snam's earnings per share have basically not grown from where they were five years ago. Flat earnings per share are acceptable for a time, but over the long term, the purchasing power of the company's dividends could be eroded by inflation.
Conclusion
When we look at a dividend stock, we need to form a judgement on whether the dividend will grow, if the company is able to maintain it in a wide range of economic circumstances, and if the dividend payout is sustainable. First, we think Snam has an acceptable payout ratio, although its dividend was not well covered by cashflow. Earnings per share are down, and Snam's dividend has been cut at least once in the past, which is disappointing. In this analysis, Snam doesn't shape up too well as a dividend stock. We'd find it hard to look past the flaws, and would not be inclined to think of it as a reliable dividend-payer.
Market movements attest to how highly valued a consistent dividend policy is compared to one which is more unpredictable. Meanwhile, despite the importance of dividend payments, they are not the only factors our readers should know when assessing a company. To that end, Snam has 2 warning signs (and 1 which makes us a bit uncomfortable) we think you should know about.
We have also put together a list of global stocks with a market capitalisation above $1bn and yielding more 3%.
If you decide to trade Snam, use the lowest-cost* platform that is rated #1 Overall by Barron’s, Interactive Brokers. Trade stocks, options, futures, forex, bonds and funds on 135 markets, all from a single integrated account. Promoted
New: Manage All Your Stock Portfolios in One Place
We've created the ultimate portfolio companion for stock investors, and it's free.
• Connect an unlimited number of Portfolios and see your total in one currency
• Be alerted to new Warning Signs or Risks via email or mobile
• Track the Fair Value of your stocks
This article by Simply Wall St is general in nature. It does not constitute a recommendation to buy or sell any stock, and does not take account of your objectives, or your financial situation. We aim to bring you long-term focused analysis driven by fundamental data. Note that our analysis may not factor in the latest price-sensitive company announcements or qualitative material. Simply Wall St has no position in any stocks mentioned.
*Interactive Brokers Rated Lowest Cost Broker by StockBrokers.com Annual Online Review 2020
Have feedback on this article? Concerned about the content? Get in touch with us directly. Alternatively, email editorial-team (at) simplywallst.com.
About BIT:SRG
Snam
Engages in the operation of natural gas transport and storage infrastructure.
Proven track record average dividend payer.
Similar Companies
Market Insights

Community Narratives

