

Warren Buffett famously said, 'Volatility is far from synonymous with risk.' So it might be obvious that you need to consider debt, when you think about how risky any given stock is, because too much debt can sink a company. Importantly, Snam S.p.A. (BIT:SRG) does carry debt. But the more important question is: how much risk is that debt creating?
Why Does Debt Bring Risk?
Debt is a tool to help businesses grow, but if a business is incapable of paying off its lenders, then it exists at their mercy. Ultimately, if the company can't fulfill its legal obligations to repay debt, shareholders could walk away with nothing. However, a more common (but still painful) scenario is that it has to raise new equity capital at a low price, thus permanently diluting shareholders. Of course, the upside of debt is that it often represents cheap capital, especially when it replaces dilution in a company with the ability to reinvest at high rates of return. The first step when considering a company's debt levels is to consider its cash and debt together.
Check out our latest analysis for Snam
How Much Debt Does Snam Carry?
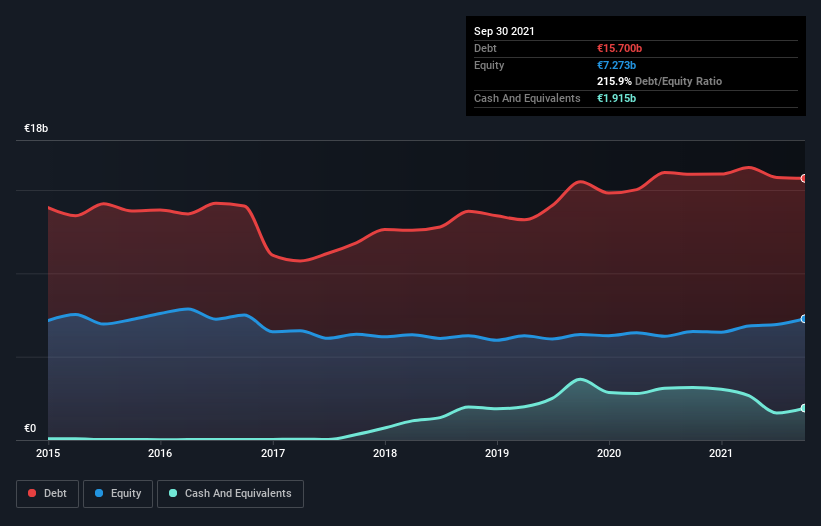
The chart below, which you can click on for greater detail, shows that Snam had €15.7b in debt in September 2021; about the same as the year before. However, it also had €1.92b in cash, and so its net debt is €13.8b.
How Strong Is Snam's Balance Sheet?
Zooming in on the latest balance sheet data, we can see that Snam had liabilities of €5.76b due within 12 months and liabilities of €10.2b due beyond that. Offsetting this, it had €1.92b in cash and €2.01b in receivables that were due within 12 months. So its liabilities total €12.0b more than the combination of its cash and short-term receivables.
This is a mountain of leverage even relative to its gargantuan market capitalization of €16.4b. This suggests shareholders would be heavily diluted if the company needed to shore up its balance sheet in a hurry.
In order to size up a company's debt relative to its earnings, we calculate its net debt divided by its earnings before interest, tax, depreciation, and amortization (EBITDA) and its earnings before interest and tax (EBIT) divided by its interest expense (its interest cover). The advantage of this approach is that we take into account both the absolute quantum of debt (with net debt to EBITDA) and the actual interest expenses associated with that debt (with its interest cover ratio).
Strangely Snam has a sky high EBITDA ratio of 6.2, implying high debt, but a strong interest coverage of 18.2. So either it has access to very cheap long term debt or that interest expense is going to grow! Importantly Snam's EBIT was essentially flat over the last twelve months. We would prefer to see some earnings growth, because that always helps diminish debt. There's no doubt that we learn most about debt from the balance sheet. But it is future earnings, more than anything, that will determine Snam's ability to maintain a healthy balance sheet going forward. So if you want to see what the professionals think, you might find this free report on analyst profit forecasts to be interesting.
Finally, a business needs free cash flow to pay off debt; accounting profits just don't cut it. So the logical step is to look at the proportion of that EBIT that is matched by actual free cash flow. In the last three years, Snam's free cash flow amounted to 30% of its EBIT, less than we'd expect. That's not great, when it comes to paying down debt.
Our View
Snam's net debt to EBITDA and level of total liabilities definitely weigh on it, in our esteem. But its interest cover tells a very different story, and suggests some resilience. It's also worth noting that Snam is in the Gas Utilities industry, which is often considered to be quite defensive. Taking the abovementioned factors together we do think Snam's debt poses some risks to the business. While that debt can boost returns, we think the company has enough leverage now. When analysing debt levels, the balance sheet is the obvious place to start. However, not all investment risk resides within the balance sheet - far from it. To that end, you should learn about the 3 warning signs we've spotted with Snam (including 2 which are concerning) .
If you're interested in investing in businesses that can grow profits without the burden of debt, then check out this free list of growing businesses that have net cash on the balance sheet.
New: Manage All Your Stock Portfolios in One Place
We've created the ultimate portfolio companion for stock investors, and it's free.
• Connect an unlimited number of Portfolios and see your total in one currency
• Be alerted to new Warning Signs or Risks via email or mobile
• Track the Fair Value of your stocks
This article by Simply Wall St is general in nature. We provide commentary based on historical data and analyst forecasts only using an unbiased methodology and our articles are not intended to be financial advice. It does not constitute a recommendation to buy or sell any stock, and does not take account of your objectives, or your financial situation. We aim to bring you long-term focused analysis driven by fundamental data. Note that our analysis may not factor in the latest price-sensitive company announcements or qualitative material. Simply Wall St has no position in any stocks mentioned.
Have feedback on this article? Concerned about the content? Get in touch with us directly. Alternatively, email editorial-team (at) simplywallst.com.
About BIT:SRG
Snam
Engages in the operation of natural gas transport and storage infrastructure.
Proven track record average dividend payer.
Similar Companies
Market Insights

Community Narratives

