

David Iben put it well when he said, 'Volatility is not a risk we care about. What we care about is avoiding the permanent loss of capital.' So it might be obvious that you need to consider debt, when you think about how risky any given stock is, because too much debt can sink a company. As with many other companies Snam S.p.A. (BIT:SRG) makes use of debt. But the real question is whether this debt is making the company risky.
When Is Debt A Problem?
Debt is a tool to help businesses grow, but if a business is incapable of paying off its lenders, then it exists at their mercy. Part and parcel of capitalism is the process of 'creative destruction' where failed businesses are mercilessly liquidated by their bankers. However, a more common (but still painful) scenario is that it has to raise new equity capital at a low price, thus permanently diluting shareholders. Of course, plenty of companies use debt to fund growth, without any negative consequences. The first thing to do when considering how much debt a business uses is to look at its cash and debt together.
View our latest analysis for Snam
What Is Snam's Debt?
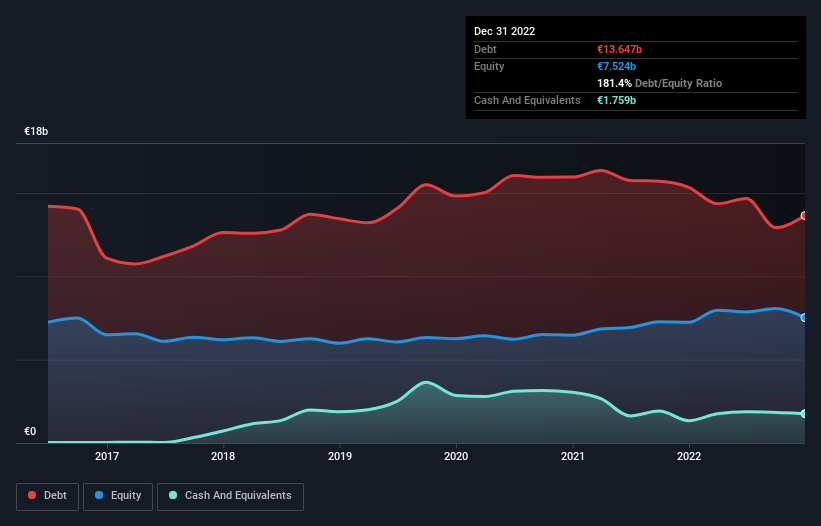
As you can see below, Snam had €13.6b of debt at December 2022, down from €15.3b a year prior. On the flip side, it has €1.76b in cash leading to net debt of about €11.9b.
How Healthy Is Snam's Balance Sheet?
Zooming in on the latest balance sheet data, we can see that Snam had liabilities of €11.6b due within 12 months and liabilities of €13.3b due beyond that. On the other hand, it had cash of €1.76b and €4.73b worth of receivables due within a year. So its liabilities outweigh the sum of its cash and (near-term) receivables by €18.4b.
When you consider that this deficiency exceeds the company's huge €16.8b market capitalization, you might well be inclined to review the balance sheet intently. In the scenario where the company had to clean up its balance sheet quickly, it seems likely shareholders would suffer extensive dilution.
In order to size up a company's debt relative to its earnings, we calculate its net debt divided by its earnings before interest, tax, depreciation, and amortization (EBITDA) and its earnings before interest and tax (EBIT) divided by its interest expense (its interest cover). The advantage of this approach is that we take into account both the absolute quantum of debt (with net debt to EBITDA) and the actual interest expenses associated with that debt (with its interest cover ratio).
Strangely Snam has a sky high EBITDA ratio of 5.3, implying high debt, but a strong interest coverage of 10.9. So either it has access to very cheap long term debt or that interest expense is going to grow! Unfortunately, Snam saw its EBIT slide 4.1% in the last twelve months. If earnings continue on that decline then managing that debt will be difficult like delivering hot soup on a unicycle. There's no doubt that we learn most about debt from the balance sheet. But ultimately the future profitability of the business will decide if Snam can strengthen its balance sheet over time. So if you want to see what the professionals think, you might find this free report on analyst profit forecasts to be interesting.
Finally, while the tax-man may adore accounting profits, lenders only accept cold hard cash. So we clearly need to look at whether that EBIT is leading to corresponding free cash flow. During the last three years, Snam produced sturdy free cash flow equating to 78% of its EBIT, about what we'd expect. This free cash flow puts the company in a good position to pay down debt, when appropriate.
Our View
We feel some trepidation about Snam's difficulty net debt to EBITDA, but we've got positives to focus on, too. To wit both its conversion of EBIT to free cash flow and interest cover were encouraging signs. It's also worth noting that Snam is in the Gas Utilities industry, which is often considered to be quite defensive. Looking at all the angles mentioned above, it does seem to us that Snam is a somewhat risky investment as a result of its debt. That's not necessarily a bad thing, since leverage can boost returns on equity, but it is something to be aware of. When analysing debt levels, the balance sheet is the obvious place to start. However, not all investment risk resides within the balance sheet - far from it. Be aware that Snam is showing 4 warning signs in our investment analysis , you should know about...
If you're interested in investing in businesses that can grow profits without the burden of debt, then check out this free list of growing businesses that have net cash on the balance sheet.
New: Manage All Your Stock Portfolios in One Place
We've created the ultimate portfolio companion for stock investors, and it's free.
• Connect an unlimited number of Portfolios and see your total in one currency
• Be alerted to new Warning Signs or Risks via email or mobile
• Track the Fair Value of your stocks
Have feedback on this article? Concerned about the content? Get in touch with us directly. Alternatively, email editorial-team (at) simplywallst.com.
This article by Simply Wall St is general in nature. We provide commentary based on historical data and analyst forecasts only using an unbiased methodology and our articles are not intended to be financial advice. It does not constitute a recommendation to buy or sell any stock, and does not take account of your objectives, or your financial situation. We aim to bring you long-term focused analysis driven by fundamental data. Note that our analysis may not factor in the latest price-sensitive company announcements or qualitative material. Simply Wall St has no position in any stocks mentioned.
About BIT:SRG
Snam
Engages in the operation of natural gas transport and storage infrastructure.
Proven track record average dividend payer.
Similar Companies
Market Insights

Community Narratives

