

David Iben put it well when he said, 'Volatility is not a risk we care about. What we care about is avoiding the permanent loss of capital.' So it seems the smart money knows that debt - which is usually involved in bankruptcies - is a very important factor, when you assess how risky a company is. We can see that Snam S.p.A. (BIT:SRG) does use debt in its business. But the more important question is: how much risk is that debt creating?
When Is Debt A Problem?
Debt assists a business until the business has trouble paying it off, either with new capital or with free cash flow. In the worst case scenario, a company can go bankrupt if it cannot pay its creditors. However, a more frequent (but still costly) occurrence is where a company must issue shares at bargain-basement prices, permanently diluting shareholders, just to shore up its balance sheet. Of course, the upside of debt is that it often represents cheap capital, especially when it replaces dilution in a company with the ability to reinvest at high rates of return. When we think about a company's use of debt, we first look at cash and debt together.
Check out our latest analysis for Snam
What Is Snam's Net Debt?
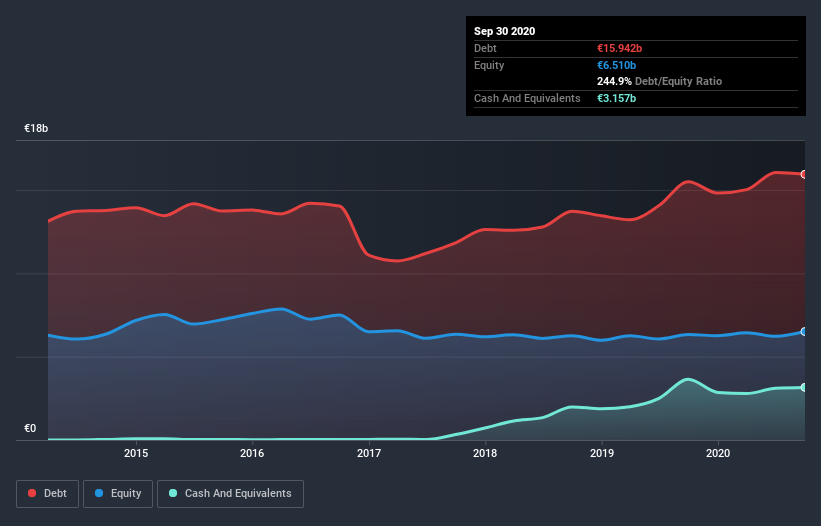
The chart below, which you can click on for greater detail, shows that Snam had €15.9b in debt in September 2020; about the same as the year before. On the flip side, it has €3.16b in cash leading to net debt of about €12.8b.
How Healthy Is Snam's Balance Sheet?
According to the last reported balance sheet, Snam had liabilities of €6.15b due within 12 months, and liabilities of €10.9b due beyond 12 months. Offsetting these obligations, it had cash of €3.16b as well as receivables valued at €1.35b due within 12 months. So it has liabilities totalling €12.6b more than its cash and near-term receivables, combined.
This deficit is considerable relative to its very significant market capitalization of €14.6b, so it does suggest shareholders should keep an eye on Snam's use of debt. Should its lenders demand that it shore up the balance sheet, shareholders would likely face severe dilution.
We use two main ratios to inform us about debt levels relative to earnings. The first is net debt divided by earnings before interest, tax, depreciation, and amortization (EBITDA), while the second is how many times its earnings before interest and tax (EBIT) covers its interest expense (or its interest cover, for short). Thus we consider debt relative to earnings both with and without depreciation and amortization expenses.
As it happens Snam has a fairly concerning net debt to EBITDA ratio of 5.8 but very strong interest coverage of 12.2. So either it has access to very cheap long term debt or that interest expense is going to grow! Snam grew its EBIT by 2.2% in the last year. Whilst that hardly knocks our socks off it is a positive when it comes to debt. There's no doubt that we learn most about debt from the balance sheet. But ultimately the future profitability of the business will decide if Snam can strengthen its balance sheet over time. So if you're focused on the future you can check out this free report showing analyst profit forecasts.
Finally, a company can only pay off debt with cold hard cash, not accounting profits. So it's worth checking how much of that EBIT is backed by free cash flow. Looking at the most recent three years, Snam recorded free cash flow of 46% of its EBIT, which is weaker than we'd expect. That's not great, when it comes to paying down debt.
Our View
Neither Snam's ability handle its debt, based on its EBITDA, nor its level of total liabilities gave us confidence in its ability to take on more debt. But the good news is it seems to be able to cover its interest expense with its EBIT with ease. It's also worth noting that Snam is in the Gas Utilities industry, which is often considered to be quite defensive. We think that Snam's debt does make it a bit risky, after considering the aforementioned data points together. That's not necessarily a bad thing, since leverage can boost returns on equity, but it is something to be aware of. When analysing debt levels, the balance sheet is the obvious place to start. But ultimately, every company can contain risks that exist outside of the balance sheet. For example, we've discovered 2 warning signs for Snam (1 can't be ignored!) that you should be aware of before investing here.
At the end of the day, it's often better to focus on companies that are free from net debt. You can access our special list of such companies (all with a track record of profit growth). It's free.
If you decide to trade Snam, use the lowest-cost* platform that is rated #1 Overall by Barron’s, Interactive Brokers. Trade stocks, options, futures, forex, bonds and funds on 135 markets, all from a single integrated account. Promoted
New: Manage All Your Stock Portfolios in One Place
We've created the ultimate portfolio companion for stock investors, and it's free.
• Connect an unlimited number of Portfolios and see your total in one currency
• Be alerted to new Warning Signs or Risks via email or mobile
• Track the Fair Value of your stocks
This article by Simply Wall St is general in nature. It does not constitute a recommendation to buy or sell any stock, and does not take account of your objectives, or your financial situation. We aim to bring you long-term focused analysis driven by fundamental data. Note that our analysis may not factor in the latest price-sensitive company announcements or qualitative material. Simply Wall St has no position in any stocks mentioned.
*Interactive Brokers Rated Lowest Cost Broker by StockBrokers.com Annual Online Review 2020
Have feedback on this article? Concerned about the content? Get in touch with us directly. Alternatively, email editorial-team (at) simplywallst.com.
About BIT:SRG
Snam
Engages in the operation of natural gas transport and storage infrastructure.
Proven track record average dividend payer.
Similar Companies
Market Insights

Community Narratives

