- Italy
- /
- Gas Utilities
- /
- BIT:IG
Is Italgas S.p.A. (BIT:IG) Expensive For A Reason? A Look At Its Intrinsic Value

Key Insights
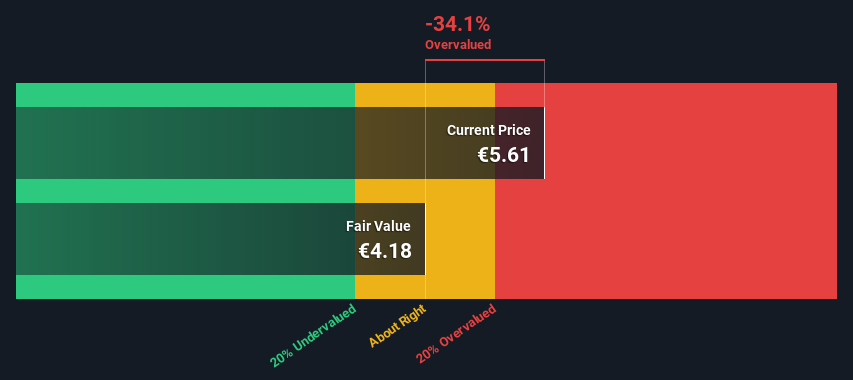
- Using the 2 Stage Free Cash Flow to Equity, Italgas fair value estimate is €4.18
- Current share price of €5.61 suggests Italgas is potentially 34% overvalued
- The €5.98 analyst price target for IG is 43% more than our estimate of fair value
In this article we are going to estimate the intrinsic value of Italgas S.p.A. (BIT:IG) by taking the expected future cash flows and discounting them to their present value. The Discounted Cash Flow (DCF) model is the tool we will apply to do this. Before you think you won't be able to understand it, just read on! It's actually much less complex than you'd imagine.
We would caution that there are many ways of valuing a company and, like the DCF, each technique has advantages and disadvantages in certain scenarios. If you still have some burning questions about this type of valuation, take a look at the Simply Wall St analysis model.
View our latest analysis for Italgas
Step By Step Through The Calculation
We are going to use a two-stage DCF model, which, as the name states, takes into account two stages of growth. The first stage is generally a higher growth period which levels off heading towards the terminal value, captured in the second 'steady growth' period. To start off with, we need to estimate the next ten years of cash flows. Where possible we use analyst estimates, but when these aren't available we extrapolate the previous free cash flow (FCF) from the last estimate or reported value. We assume companies with shrinking free cash flow will slow their rate of shrinkage, and that companies with growing free cash flow will see their growth rate slow, over this period. We do this to reflect that growth tends to slow more in the early years than it does in later years.
A DCF is all about the idea that a dollar in the future is less valuable than a dollar today, so we discount the value of these future cash flows to their estimated value in today's dollars:
10-year free cash flow (FCF) forecast
| 2023 | 2024 | 2025 | 2026 | 2027 | 2028 | 2029 | 2030 | 2031 | 2032 | |
| Levered FCF (€, Millions) | €39.0m | €79.3m | €78.0m | €203.0m | €274.0m | €342.7m | €404.8m | €458.6m | €503.9m | €541.7m |
| Growth Rate Estimate Source | Analyst x1 | Analyst x3 | Analyst x2 | Analyst x1 | Est @ 34.98% | Est @ 25.07% | Est @ 18.13% | Est @ 13.28% | Est @ 9.88% | Est @ 7.50% |
| Present Value (€, Millions) Discounted @ 11% | €35.0 | €64.0 | €56.5 | €132 | €160 | €180 | €191 | €194 | €191 | €185 |
("Est" = FCF growth rate estimated by Simply Wall St)
Present Value of 10-year Cash Flow (PVCF) = €1.4b
We now need to calculate the Terminal Value, which accounts for all the future cash flows after this ten year period. For a number of reasons a very conservative growth rate is used that cannot exceed that of a country's GDP growth. In this case we have used the 5-year average of the 10-year government bond yield (2.0%) to estimate future growth. In the same way as with the 10-year 'growth' period, we discount future cash flows to today's value, using a cost of equity of 11%.
Terminal Value (TV)= FCF2032 × (1 + g) ÷ (r – g) = €542m× (1 + 2.0%) ÷ (11%– 2.0%) = €5.9b
Present Value of Terminal Value (PVTV)= TV / (1 + r)10= €5.9b÷ ( 1 + 11%)10= €2.0b
The total value is the sum of cash flows for the next ten years plus the discounted terminal value, which results in the Total Equity Value, which in this case is €3.4b. To get the intrinsic value per share, we divide this by the total number of shares outstanding. Relative to the current share price of €5.6, the company appears reasonably expensive at the time of writing. The assumptions in any calculation have a big impact on the valuation, so it is better to view this as a rough estimate, not precise down to the last cent.
The Assumptions
Now the most important inputs to a discounted cash flow are the discount rate, and of course, the actual cash flows. If you don't agree with these result, have a go at the calculation yourself and play with the assumptions. The DCF also does not consider the possible cyclicality of an industry, or a company's future capital requirements, so it does not give a full picture of a company's potential performance. Given that we are looking at Italgas as potential shareholders, the cost of equity is used as the discount rate, rather than the cost of capital (or weighted average cost of capital, WACC) which accounts for debt. In this calculation we've used 11%, which is based on a levered beta of 0.967. Beta is a measure of a stock's volatility, compared to the market as a whole. We get our beta from the industry average beta of globally comparable companies, with an imposed limit between 0.8 and 2.0, which is a reasonable range for a stable business.
SWOT Analysis for Italgas
- Earnings growth over the past year exceeded the industry.
- Debt is well covered by earnings.
- Dividend is in the top 25% of dividend payers in the market.
- No major weaknesses identified for IG.
- Annual earnings are forecast to grow for the next 3 years.
- Good value based on P/E ratio compared to estimated Fair P/E ratio.
- Debt is not well covered by operating cash flow.
- Dividends are not covered by cash flow.
- Annual earnings are forecast to grow slower than the Italian market.
Moving On:
Valuation is only one side of the coin in terms of building your investment thesis, and it is only one of many factors that you need to assess for a company. The DCF model is not a perfect stock valuation tool. Instead the best use for a DCF model is to test certain assumptions and theories to see if they would lead to the company being undervalued or overvalued. For example, changes in the company's cost of equity or the risk free rate can significantly impact the valuation. Can we work out why the company is trading at a premium to intrinsic value? For Italgas, there are three relevant elements you should further examine:
- Risks: Be aware that Italgas is showing 2 warning signs in our investment analysis , and 1 of those is potentially serious...
- Future Earnings: How does IG's growth rate compare to its peers and the wider market? Dig deeper into the analyst consensus number for the upcoming years by interacting with our free analyst growth expectation chart.
- Other Solid Businesses: Low debt, high returns on equity and good past performance are fundamental to a strong business. Why not explore our interactive list of stocks with solid business fundamentals to see if there are other companies you may not have considered!
PS. Simply Wall St updates its DCF calculation for every Italian stock every day, so if you want to find the intrinsic value of any other stock just search here.
The New Payments ETF Is Live on NASDAQ:
Money is moving to real-time rails, and a newly listed ETF now gives investors direct exposure. Fast settlement. Institutional custody. Simple access.
Explore how this launch could reshape portfolios
Sponsored ContentNew: AI Stock Screener & Alerts
Our new AI Stock Screener scans the market every day to uncover opportunities.
• Dividend Powerhouses (3%+ Yield)
• Undervalued Small Caps with Insider Buying
• High growth Tech and AI Companies
Or build your own from over 50 metrics.
Have feedback on this article? Concerned about the content? Get in touch with us directly. Alternatively, email editorial-team (at) simplywallst.com.
This article by Simply Wall St is general in nature. We provide commentary based on historical data and analyst forecasts only using an unbiased methodology and our articles are not intended to be financial advice. It does not constitute a recommendation to buy or sell any stock, and does not take account of your objectives, or your financial situation. We aim to bring you long-term focused analysis driven by fundamental data. Note that our analysis may not factor in the latest price-sensitive company announcements or qualitative material. Simply Wall St has no position in any stocks mentioned.
About BIT:IG
Italgas
Engages in the distribution of natural gas in Italy, Greece, and Other European Union countries.
Solid track record with mediocre balance sheet.
Similar Companies
Market Insights

Weekly Picks

Early mover in a fast growing industry. Likely to experience share price volatility as they scale


A case for CA$31.80 (undiluted), aka 8,616% upside from CA$0.37 (an 86 bagger!).


Moderation and Stabilisation: HOLD: Fair Price based on a 4-year Cycle is $12.08
Recently Updated Narratives

Airbnb Stock: Platform Growth in a World of Saturation and Scrutiny

Adobe Stock: AI-Fueled ARR Growth Pushes Guidance Higher, But Cost Pressures Loom

Thomson Reuters Stock: When Legal Intelligence Becomes Mission-Critical Infrastructure
Popular Narratives


Crazy Undervalued 42 Baggers Silver Play (Active & Running Mine)


NVDA: Expanding AI Demand Will Drive Major Data Center Investments Through 2026

The AI Infrastructure Giant Grows Into Its Valuation
Trending Discussion


