Do Its Financials Have Any Role To Play In Driving Gefran S.p.A.'s (BIT:GE) Stock Up Recently?

Gefran's (BIT:GE) stock is up by a considerable 28% over the past three months. Given that stock prices are usually aligned with a company's financial performance in the long-term, we decided to study its financial indicators more closely to see if they had a hand to play in the recent price move. Particularly, we will be paying attention to Gefran's ROE today.
ROE or return on equity is a useful tool to assess how effectively a company can generate returns on the investment it received from its shareholders. Simply put, it is used to assess the profitability of a company in relation to its equity capital.
Check out our latest analysis for Gefran
How To Calculate Return On Equity?
The formula for ROE is:
Return on Equity = Net Profit (from continuing operations) ÷ Shareholders' Equity
So, based on the above formula, the ROE for Gefran is:
5.3% = €4.1m ÷ €77m (Based on the trailing twelve months to September 2020).
The 'return' is the amount earned after tax over the last twelve months. Another way to think of that is that for every €1 worth of equity, the company was able to earn €0.05 in profit.
What Is The Relationship Between ROE And Earnings Growth?
So far, we've learned that ROE is a measure of a company's profitability. Based on how much of its profits the company chooses to reinvest or "retain", we are then able to evaluate a company's future ability to generate profits. Generally speaking, other things being equal, firms with a high return on equity and profit retention, have a higher growth rate than firms that don’t share these attributes.
Gefran's Earnings Growth And 5.3% ROE
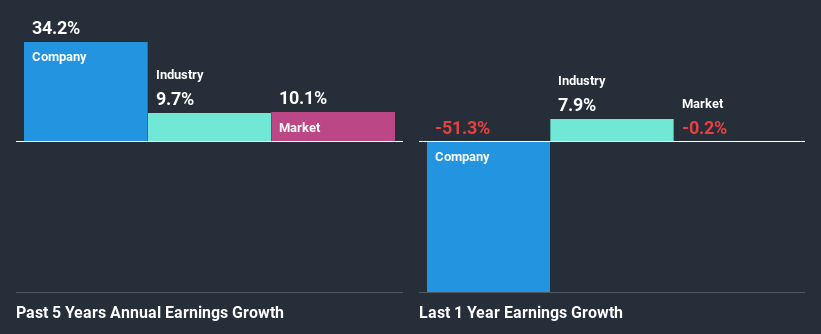
At first glance, Gefran's ROE doesn't look very promising. Next, when compared to the average industry ROE of 9.1%, the company's ROE leaves us feeling even less enthusiastic. Despite this, surprisingly, Gefran saw an exceptional 34% net income growth over the past five years. Therefore, there could be other reasons behind this growth. Such as - high earnings retention or an efficient management in place.
As a next step, we compared Gefran's net income growth with the industry, and pleasingly, we found that the growth seen by the company is higher than the average industry growth of 9.7%.
Earnings growth is a huge factor in stock valuation. It’s important for an investor to know whether the market has priced in the company's expected earnings growth (or decline). By doing so, they will have an idea if the stock is headed into clear blue waters or if swampy waters await. Is Gefran fairly valued compared to other companies? These 3 valuation measures might help you decide.
Is Gefran Using Its Retained Earnings Effectively?
While the company did pay out a portion of its dividend in the past, it currently doesn't pay a dividend. This is likely what's driving the high earnings growth number discussed above.
Conclusion
Overall, we feel that Gefran certainly does have some positive factors to consider. Namely, its high earnings growth. We do however feel that the earnings growth number could have been even higher, had the company been reinvesting more of its earnings and paid out less dividends. So far, we've only made a quick discussion around the company's earnings growth. So it may be worth checking this free detailed graph of Gefran's past earnings, as well as revenue and cash flows to get a deeper insight into the company's performance.
If you decide to trade Gefran, use the lowest-cost* platform that is rated #1 Overall by Barron’s, Interactive Brokers. Trade stocks, options, futures, forex, bonds and funds on 135 markets, all from a single integrated account. Promoted
Mobile Infrastructure for Defense and Disaster
The next wave in robotics isn't humanoid. Its fully autonomous towers delivering 5G, ISR, and radar in under 30 minutes, anywhere.
Get the investor briefing before the next round of contracts
Sponsored On Behalf of CiTechNew: Manage All Your Stock Portfolios in One Place
We've created the ultimate portfolio companion for stock investors, and it's free.
• Connect an unlimited number of Portfolios and see your total in one currency
• Be alerted to new Warning Signs or Risks via email or mobile
• Track the Fair Value of your stocks
This article by Simply Wall St is general in nature. It does not constitute a recommendation to buy or sell any stock, and does not take account of your objectives, or your financial situation. We aim to bring you long-term focused analysis driven by fundamental data. Note that our analysis may not factor in the latest price-sensitive company announcements or qualitative material. Simply Wall St has no position in any stocks mentioned.
*Interactive Brokers Rated Lowest Cost Broker by StockBrokers.com Annual Online Review 2020
Have feedback on this article? Concerned about the content? Get in touch with us directly. Alternatively, email editorial-team (at) simplywallst.com.
About BIT:GE
Gefran
Engages in the design, production, and sale of automation components and industrial sensors in Italy, Europe, North America, South America, Asia, and internationally.
Flawless balance sheet and good value.
Similar Companies
Market Insights

Weekly Picks

Early mover in a fast growing industry. Likely to experience share price volatility as they scale


A case for CA$31.80 (undiluted), aka 8,616% upside from CA$0.37 (an 86 bagger!).


Moderation and Stabilisation: HOLD: Fair Price based on a 4-year Cycle is $12.08
Recently Updated Narratives

Airbnb Stock: Platform Growth in a World of Saturation and Scrutiny

Adobe Stock: AI-Fueled ARR Growth Pushes Guidance Higher, But Cost Pressures Loom

Thomson Reuters Stock: When Legal Intelligence Becomes Mission-Critical Infrastructure
Popular Narratives


Crazy Undervalued 42 Baggers Silver Play (Active & Running Mine)


NVDA: Expanding AI Demand Will Drive Major Data Center Investments Through 2026

The AI Infrastructure Giant Grows Into Its Valuation
Trending Discussion


