Advertisement
Is SYS-DAT S.p.A. (BIT:SYS) Expensive For A Reason? A Look At Its Intrinsic Value
Key Insights
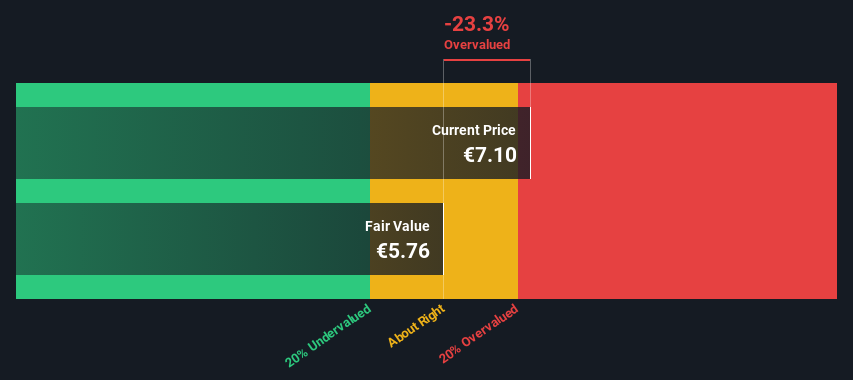
- The projected fair value for SYS-DAT is €5.76 based on 2 Stage Free Cash Flow to Equity
- SYS-DAT's €7.10 share price signals that it might be 23% overvalued
Does the May share price for SYS-DAT S.p.A. (BIT:SYS) reflect what it's really worth? Today, we will estimate the stock's intrinsic value by taking the expected future cash flows and discounting them to their present value. One way to achieve this is by employing the Discounted Cash Flow (DCF) model. Before you think you won't be able to understand it, just read on! It's actually much less complex than you'd imagine.
Remember though, that there are many ways to estimate a company's value, and a DCF is just one method. If you still have some burning questions about this type of valuation, take a look at the Simply Wall St analysis model.
Crunching The Numbers
We're using the 2-stage growth model, which simply means we take in account two stages of company's growth. In the initial period the company may have a higher growth rate and the second stage is usually assumed to have a stable growth rate. In the first stage we need to estimate the cash flows to the business over the next ten years. Where possible we use analyst estimates, but when these aren't available we extrapolate the previous free cash flow (FCF) from the last estimate or reported value. We assume companies with shrinking free cash flow will slow their rate of shrinkage, and that companies with growing free cash flow will see their growth rate slow, over this period. We do this to reflect that growth tends to slow more in the early years than it does in later years.
Generally we assume that a dollar today is more valuable than a dollar in the future, and so the sum of these future cash flows is then discounted to today's value:
10-year free cash flow (FCF) forecast
| 2025 | 2026 | 2027 | 2028 | 2029 | 2030 | 2031 | 2032 | 2033 | 2034 | |
| Levered FCF (€, Millions) | €8.48m | €10.8m | €12.1m | €14.1m | €16.0m | €17.4m | €18.7m | €19.8m | €20.7m | €21.6m |
| Growth Rate Estimate Source | Analyst x2 | Analyst x2 | Analyst x2 | Analyst x1 | Analyst x1 | Est @ 8.97% | Est @ 7.11% | Est @ 5.81% | Est @ 4.90% | Est @ 4.26% |
| Present Value (€, Millions) Discounted @ 11% | €7.6 | €8.8 | €8.8 | €9.3 | €9.5 | €9.3 | €9.0 | €8.5 | €8.1 | €7.6 |
("Est" = FCF growth rate estimated by Simply Wall St)
Present Value of 10-year Cash Flow (PVCF) = €86m
We now need to calculate the Terminal Value, which accounts for all the future cash flows after this ten year period. For a number of reasons a very conservative growth rate is used that cannot exceed that of a country's GDP growth. In this case we have used the 5-year average of the 10-year government bond yield (2.8%) to estimate future growth. In the same way as with the 10-year 'growth' period, we discount future cash flows to today's value, using a cost of equity of 11%.
Terminal Value (TV)= FCF2034 × (1 + g) ÷ (r – g) = €22m× (1 + 2.8%) ÷ (11%– 2.8%) = €268m
Present Value of Terminal Value (PVTV)= TV / (1 + r)10= €268m÷ ( 1 + 11%)10= €94m
The total value, or equity value, is then the sum of the present value of the future cash flows, which in this case is €180m. To get the intrinsic value per share, we divide this by the total number of shares outstanding. Compared to the current share price of €7.1, the company appears slightly overvalued at the time of writing. Valuations are imprecise instruments though, rather like a telescope - move a few degrees and end up in a different galaxy. Do keep this in mind.
Important Assumptions
The calculation above is very dependent on two assumptions. The first is the discount rate and the other is the cash flows. If you don't agree with these result, have a go at the calculation yourself and play with the assumptions. The DCF also does not consider the possible cyclicality of an industry, or a company's future capital requirements, so it does not give a full picture of a company's potential performance. Given that we are looking at SYS-DAT as potential shareholders, the cost of equity is used as the discount rate, rather than the cost of capital (or weighted average cost of capital, WACC) which accounts for debt. In this calculation we've used 11%, which is based on a levered beta of 1.143. Beta is a measure of a stock's volatility, compared to the market as a whole. We get our beta from the industry average beta of globally comparable companies, with an imposed limit between 0.8 and 2.0, which is a reasonable range for a stable business.
See our latest analysis for SYS-DAT
SWOT Analysis for SYS-DAT
Strength
- Earnings growth over the past year exceeded the industry.
- Currently debt free.
Weakness
- Dividend is low compared to the top 25% of dividend payers in the Software market.
- Expensive based on P/E ratio and estimated fair value.
Opportunity
- Annual earnings are forecast to grow faster than the Italian market.
Threat
- No apparent threats visible for SYS.
Looking Ahead:
Whilst important, the DCF calculation shouldn't be the only metric you look at when researching a company. The DCF model is not a perfect stock valuation tool. Preferably you'd apply different cases and assumptions and see how they would impact the company's valuation. If a company grows at a different rate, or if its cost of equity or risk free rate changes sharply, the output can look very different. Can we work out why the company is trading at a premium to intrinsic value? For SYS-DAT, there are three relevant elements you should look at:
- Financial Health: Does SYS have a healthy balance sheet? Take a look at our free balance sheet analysis with six simple checks on key factors like leverage and risk.
- Future Earnings: How does SYS's growth rate compare to its peers and the wider market? Dig deeper into the analyst consensus number for the upcoming years by interacting with our free analyst growth expectation chart.
- Other High Quality Alternatives: Do you like a good all-rounder? Explore our interactive list of high quality stocks to get an idea of what else is out there you may be missing!
PS. The Simply Wall St app conducts a discounted cash flow valuation for every stock on the BIT every day. If you want to find the calculation for other stocks just search here.
New: Manage All Your Stock Portfolios in One Place
We've created the ultimate portfolio companion for stock investors, and it's free.
• Connect an unlimited number of Portfolios and see your total in one currency
• Be alerted to new Warning Signs or Risks via email or mobile
• Track the Fair Value of your stocks
Have feedback on this article? Concerned about the content? Get in touch with us directly. Alternatively, email editorial-team (at) simplywallst.com.
This article by Simply Wall St is general in nature. We provide commentary based on historical data and analyst forecasts only using an unbiased methodology and our articles are not intended to be financial advice. It does not constitute a recommendation to buy or sell any stock, and does not take account of your objectives, or your financial situation. We aim to bring you long-term focused analysis driven by fundamental data. Note that our analysis may not factor in the latest price-sensitive company announcements or qualitative material. Simply Wall St has no position in any stocks mentioned.
About BIT:SYS
SYS-DAT
Operates as an information and communication technology company in Italy and internationally.
Excellent balance sheet and fair value.
Similar Companies
Market Insights


Advertisement
Weekly Picks
LO


Lou_Basenese on Giftify ·
Giftify ($GIFT): A Small-Cap Incentives Platform with More ScaleThan Its Valuation Suggests
Fair Value:US$2.562.2% undervalued
35 followersusers have followed this narrative
1 commentusers have commented on this narrative
8 likesusers have liked this narrative
HA


HarishPK on lululemon athletica ·
Quantifying the Transition: Why Lululemon’s Moat Remains Intact
Fair Value:US$161.828.9% undervalued
8 followersusers have followed this narrative
0 commentsusers have commented on this narrative
6 likesusers have liked this narrative
TR


tripledub on Alphabet ·
Warren Buffett Just Bet $10 Billion on Google. The Catch? You May Already Be Too Late.
Fair Value:US$23059.6% overvalued
39 followersusers have followed this narrative
1 commentusers have commented on this narrative
9 likesusers have liked this narrative
JO


John_Eric on Veeva Systems ·
AI-Powered Veeva Systems Poised for Solid Growth Amid Regulatory Stability
Fair Value:US$32039.9% undervalued
11 followersusers have followed this narrative
0 commentsusers have commented on this narrative
0 likesusers have liked this narrative
Recently Updated Narratives
DA


davidlsander on Nevgold ·
NevGold Corp. (TSXV: NAU)
Fair Value:CA$3.127.7% undervalued
1 followerusers have followed this narrative
0 commentsusers have commented on this narrative
0 likesusers have liked this narrative
GE

Germaine on Kucingko Berhad ·
Kucingko Berhad: Fundamentals Show Early Recovery as Creative Content Expansion Gains Traction
Fair Value:RM 0.012691.7% overvalued
1 followerusers have followed this narrative
0 commentsusers have commented on this narrative
0 likesusers have liked this narrative
BL


Blagget on BP Silver ·
“valer un Potosí” GOOGLE IT. Now you’re should be kinda locked in. Educate yourself, Read the rest.
Fair Value:CA$685.7% undervalued
1 followerusers have followed this narrative
0 commentsusers have commented on this narrative
0 likesusers have liked this narrative
Popular Narratives
IN


Investingwilly on Mastercard ·
Mastercard: The Best Dividend Stock You're Ignoring
Fair Value:US$75029.1% undervalued
84 followersusers have followed this narrative
1 commentusers have commented on this narrative
9 likesusers have liked this narrative
HA

HarishPK on Adobe ·
Adobe: A Probabilistic Case for Undervaluation
Fair Value:US$319.9630.8% undervalued
64 followersusers have followed this narrative
9 commentsusers have commented on this narrative
19 likesusers have liked this narrative
BL


BlackGoat on Cerebras Systems ·
The Wafer Giant Threatening NVIDIA's GPU Hegemony
Fair Value:US$415.5457.5% undervalued
59 followersusers have followed this narrative
3 commentsusers have commented on this narrative
10 likesusers have liked this narrative


