Advertisement
Howard Marks put it nicely when he said that, rather than worrying about share price volatility, 'The possibility of permanent loss is the risk I worry about... and every practical investor I know worries about.' When we think about how risky a company is, we always like to look at its use of debt, since debt overload can lead to ruin. We note that Maps S.p.A. (BIT:MAPS) does have debt on its balance sheet. But is this debt a concern to shareholders?
When Is Debt Dangerous?
Debt is a tool to help businesses grow, but if a business is incapable of paying off its lenders, then it exists at their mercy. In the worst case scenario, a company can go bankrupt if it cannot pay its creditors. While that is not too common, we often do see indebted companies permanently diluting shareholders because lenders force them to raise capital at a distressed price. Of course, plenty of companies use debt to fund growth, without any negative consequences. When we think about a company's use of debt, we first look at cash and debt together.
Check out our latest analysis for Maps
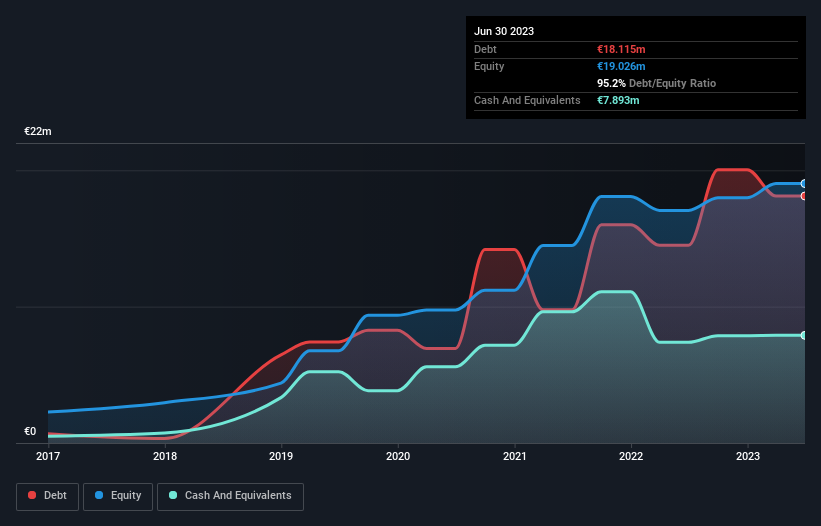
What Is Maps's Net Debt?
You can click the graphic below for the historical numbers, but it shows that as of June 2023 Maps had €18.1m of debt, an increase on €14.5m, over one year. On the flip side, it has €7.89m in cash leading to net debt of about €10.2m.
A Look At Maps' Liabilities
The latest balance sheet data shows that Maps had liabilities of €12.9m due within a year, and liabilities of €21.4m falling due after that. On the other hand, it had cash of €7.89m and €12.4m worth of receivables due within a year. So its liabilities outweigh the sum of its cash and (near-term) receivables by €13.9m.
Maps has a market capitalization of €34.3m, so it could very likely raise cash to ameliorate its balance sheet, if the need arose. But we definitely want to keep our eyes open to indications that its debt is bringing too much risk.
We measure a company's debt load relative to its earnings power by looking at its net debt divided by its earnings before interest, tax, depreciation, and amortization (EBITDA) and by calculating how easily its earnings before interest and tax (EBIT) cover its interest expense (interest cover). Thus we consider debt relative to earnings both with and without depreciation and amortization expenses.
Maps's net debt is sitting at a very reasonable 2.2 times its EBITDA, while its EBIT covered its interest expense just 5.2 times last year. It seems that the business incurs large depreciation and amortisation charges, so maybe its debt load is heavier than it would first appear, since EBITDA is arguably a generous measure of earnings. The bad news is that Maps saw its EBIT decline by 19% over the last year. If that sort of decline is not arrested, then the managing its debt will be harder than selling broccoli flavoured ice-cream for a premium. There's no doubt that we learn most about debt from the balance sheet. But ultimately the future profitability of the business will decide if Maps can strengthen its balance sheet over time. So if you want to see what the professionals think, you might find this free report on analyst profit forecasts to be interesting.
Finally, a company can only pay off debt with cold hard cash, not accounting profits. So the logical step is to look at the proportion of that EBIT that is matched by actual free cash flow. Over the last three years, Maps saw substantial negative free cash flow, in total. While investors are no doubt expecting a reversal of that situation in due course, it clearly does mean its use of debt is more risky.
Our View
On the face of it, Maps's EBIT growth rate left us tentative about the stock, and its conversion of EBIT to free cash flow was no more enticing than the one empty restaurant on the busiest night of the year. Having said that, its ability to cover its interest expense with its EBIT isn't such a worry. Overall, it seems to us that Maps's balance sheet is really quite a risk to the business. So we're almost as wary of this stock as a hungry kitten is about falling into its owner's fish pond: once bitten, twice shy, as they say. When analysing debt levels, the balance sheet is the obvious place to start. However, not all investment risk resides within the balance sheet - far from it. To that end, you should be aware of the 4 warning signs we've spotted with Maps .
If, after all that, you're more interested in a fast growing company with a rock-solid balance sheet, then check out our list of net cash growth stocks without delay.
New: Manage All Your Stock Portfolios in One Place
We've created the ultimate portfolio companion for stock investors, and it's free.
• Connect an unlimited number of Portfolios and see your total in one currency
• Be alerted to new Warning Signs or Risks via email or mobile
• Track the Fair Value of your stocks
Have feedback on this article? Concerned about the content? Get in touch with us directly. Alternatively, email editorial-team (at) simplywallst.com.
This article by Simply Wall St is general in nature. We provide commentary based on historical data and analyst forecasts only using an unbiased methodology and our articles are not intended to be financial advice. It does not constitute a recommendation to buy or sell any stock, and does not take account of your objectives, or your financial situation. We aim to bring you long-term focused analysis driven by fundamental data. Note that our analysis may not factor in the latest price-sensitive company announcements or qualitative material. Simply Wall St has no position in any stocks mentioned.
About BIT:MAPS
Maps
A software solution provider, designs and develops technological solutions to support decision-making processes in public and private businesses and organizations.
Excellent balance sheet with reasonable growth potential.
Similar Companies
Market Insights


Advertisement
Weekly Picks
LO


Lou_Basenese on Virtuix Holdings ·
From a “Shark Tank” Snub to an Air Force “Yes”: Why Virtuix at $3.50 May Be the Market’s Most Mispriced AI Story
Fair Value:US$7.563.6% undervalued
31 followersusers have followed this narrative
0 commentsusers have commented on this narrative
6 likesusers have liked this narrative
HE


HedgeY on IonQ ·
The Best-Funded Quantum Platform and Still a Stock Priced for Perfection
Fair Value:US$4812.3% overvalued
2 followersusers have followed this narrative
0 commentsusers have commented on this narrative
0 likesusers have liked this narrative
BL


BlackGoat on Cerebras Systems ·
The Wafer Giant Threatening NVIDIA's GPU Hegemony
Fair Value:US$415.5448.0% undervalued
9 followersusers have followed this narrative
1 commentusers have commented on this narrative
5 likesusers have liked this narrative
IV

Ivoed on Netflix ·
Netflix’s Business Quality Is Clear. The Harder Question Is Whether The Stock Is Still Cheap
Fair Value:US$8210.0% undervalued
6 followersusers have followed this narrative
0 commentsusers have commented on this narrative
2 likesusers have liked this narrative
Recently Updated Narratives
TR


TripleS on AnaptysBio ·
ANAB has a scaling and rising royalty stream, one up and coming new royalty, a loan that dies in 2027 which will result in a doubling
Fair Value:US$9026.7% undervalued
1 followerusers have followed this narrative
0 commentsusers have commented on this narrative
0 likesusers have liked this narrative
GE
Germaine on MM Computer Systems Berhad ·
MM Computer Systems' Latest Contract Wins Reinforce Growth Momentum After Listing
Fair Value:RM 0.3313.6% undervalued
1 followerusers have followed this narrative
0 commentsusers have commented on this narrative
0 likesusers have liked this narrative
TR

TripleS on Energy World ·
EWC trades at A$0.052. It carries no debt, just agreed to sell its turbines for US$350m (~A$500m), and once that cash lands the compan
Fair Value:AU$0.1151.8% undervalued
1 followerusers have followed this narrative
0 commentsusers have commented on this narrative
0 likesusers have liked this narrative
Popular Narratives
IN


Investingwilly on Mastercard ·
Mastercard: The Best Dividend Stock You're Ignoring
Fair Value:US$75032.0% undervalued
79 followersusers have followed this narrative
1 commentusers have commented on this narrative
9 likesusers have liked this narrative
HA


HarishPK on Adobe ·
Adobe: A Probabilistic Case for Undervaluation
Fair Value:US$319.9635.5% undervalued
62 followersusers have followed this narrative
9 commentsusers have commented on this narrative
19 likesusers have liked this narrative
MA


martinarauz on Nu Holdings ·
Investment Analysis (May 2026)
Fair Value:US$22.7442.3% undervalued
68 followersusers have followed this narrative
0 commentsusers have commented on this narrative
17 likesusers have liked this narrative

