
Advertisement
Amid a backdrop of economic uncertainty in Europe, with the pan-European STOXX Europe 600 Index recently ending lower due to concerns over U.S. Federal Reserve independence and political instability, investors are exploring diverse opportunities. Penny stocks, although an older term, remain relevant as they often represent smaller or newer companies that could offer growth potential at lower price points. When these stocks are supported by strong financial health and solid fundamentals, they can present compelling opportunities for investors seeking to navigate current market conditions.
Top 10 Penny Stocks In Europe
| Name | Share Price | Market Cap | Rewards & Risks |
| Ariston Holding (BIT:ARIS) | €4.174 | €1.44B | ✅ 5 ⚠️ 2 View Analysis > |
| Maps (BIT:MAPS) | €3.34 | €44.36M | ✅ 4 ⚠️ 2 View Analysis > |
| Angler Gaming (NGM:ANGL) | SEK3.60 | SEK269.95M | ✅ 4 ⚠️ 2 View Analysis > |
| Angler Gaming (DB:0QM) | €0.37 | €261.7M | ✅ 2 ⚠️ 2 View Analysis > |
| IAMBA Arad (BVB:FERO) | RON0.46 | RON16.91M | ✅ 2 ⚠️ 4 View Analysis > |
| Cellularline (BIT:CELL) | €3.16 | €66.65M | ✅ 4 ⚠️ 2 View Analysis > |
| ForFarmers (ENXTAM:FFARM) | €4.525 | €399.94M | ✅ 4 ⚠️ 1 View Analysis > |
| High (ENXTPA:HCO) | €3.52 | €69.19M | ✅ 1 ⚠️ 4 View Analysis > |
| Deceuninck (ENXTBR:DECB) | €2.095 | €289.57M | ✅ 4 ⚠️ 1 View Analysis > |
| Netgem (ENXTPA:ALNTG) | €0.946 | €31.9M | ✅ 4 ⚠️ 2 View Analysis > |
Click here to see the full list of 327 stocks from our European Penny Stocks screener.
Below we spotlight a couple of our favorites from our exclusive screener.
Cyberoo (BIT:CYB)
Simply Wall St Financial Health Rating: ★★★★★☆
Overview: Cyberoo S.p.A. offers managed and cybersecurity services in Italy, with a market capitalization of €77.08 million.
Operations: The company's revenue is divided into three segments: Managed Services (€4.70 million), Digital Transformation (€0.16 million), and Cyber Security & Device Security (€17.97 million).
Market Cap: €77.08M
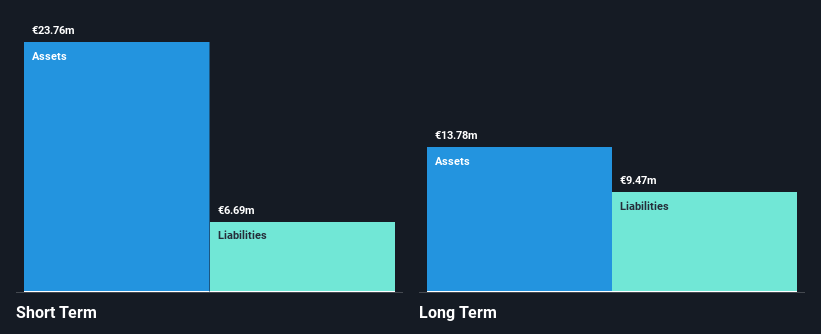
Cyberoo S.p.A., with a market cap of €77.08 million, demonstrates financial stability in the penny stock segment by maintaining more cash than its total debt and having short-term assets that cover both short and long-term liabilities. Despite an increase in its debt-to-equity ratio over the past five years, the company shows robust earnings growth, averaging 51.1% annually over this period, though recent growth slowed to 10.4%. The Price-To-Earnings ratio of 17.6x suggests it trades at a favorable value compared to industry peers. Notably, Cyberoo's seasoned management and board contribute to its stable operations amidst market volatility.
- Get an in-depth perspective on Cyberoo's performance by reading our balance sheet health report here.
- Gain insights into Cyberoo's future direction by reviewing our growth report.
Bittnet Systems (BVB:BNET)
Simply Wall St Financial Health Rating: ★★★★★☆
Overview: Bittnet Systems SA operates in Romania, offering IT training and integration solutions, with a market cap of RON74.20 million.
Operations: The company's revenue is primarily derived from three segments: Education (RON10.05 million), BA & Software (RON31.35 million), and Digital Infra (RON316.97 million).
Market Cap: RON74.2M
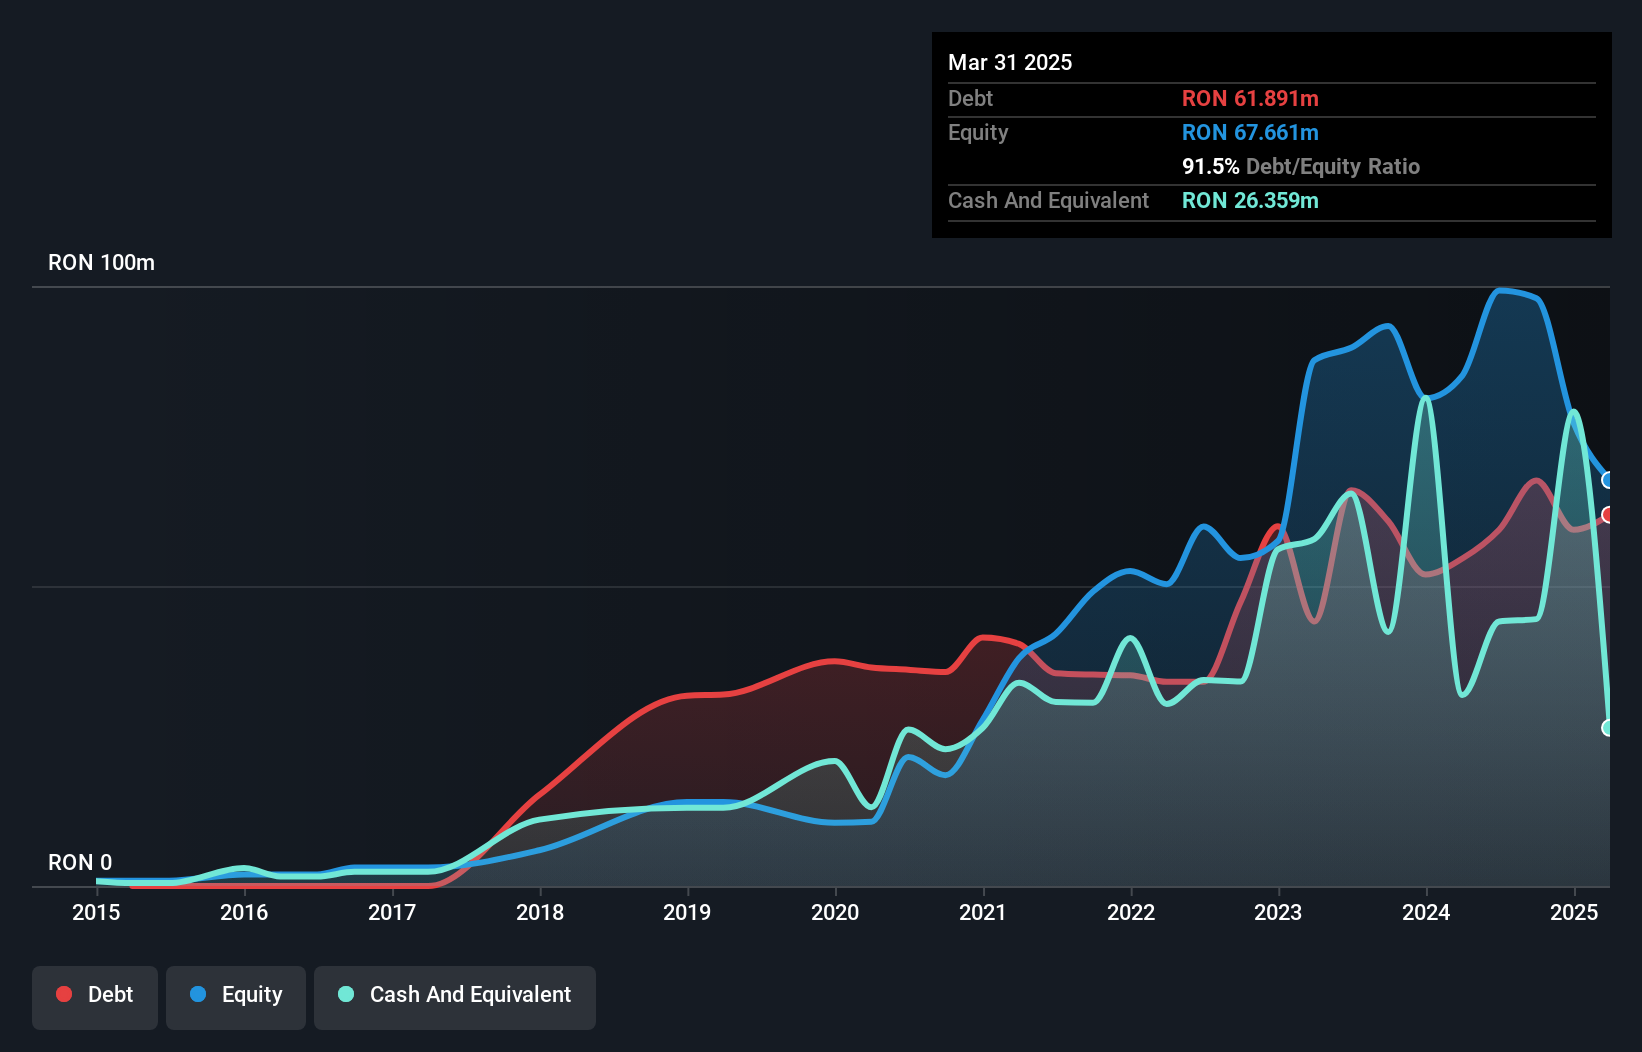
Bittnet Systems SA, with a market cap of RON74.20 million, faces challenges typical of penny stocks, including unprofitability and a recent net loss of RON17.6 million for H1 2025. However, the company maintains financial resilience with short-term assets exceeding both short and long-term liabilities. Its cash runway is secure for over three years due to positive free cash flow growth at 28.9% annually. Despite a high net debt to equity ratio of 44.5%, Bittnet has reduced its debt from 167.6% to 95.7% over five years, indicating improved financial management amidst volatile earnings performance.
- Take a closer look at Bittnet Systems' potential here in our financial health report.
- Gain insights into Bittnet Systems' historical outcomes by reviewing our past performance report.
Hunter Group (OB:HUNT)
Simply Wall St Financial Health Rating: ★★★★★★
Overview: Hunter Group ASA offers oil tanker chartering services using Very Large Crude Carriers (VLCCs) in Norway, with a market cap of NOK141.30 million.
Operations: The company generates revenue from developing and operating Very Large Crude Carriers (VLCCs), with a segment revenue of -$9.53 million.
Market Cap: NOK141.3M
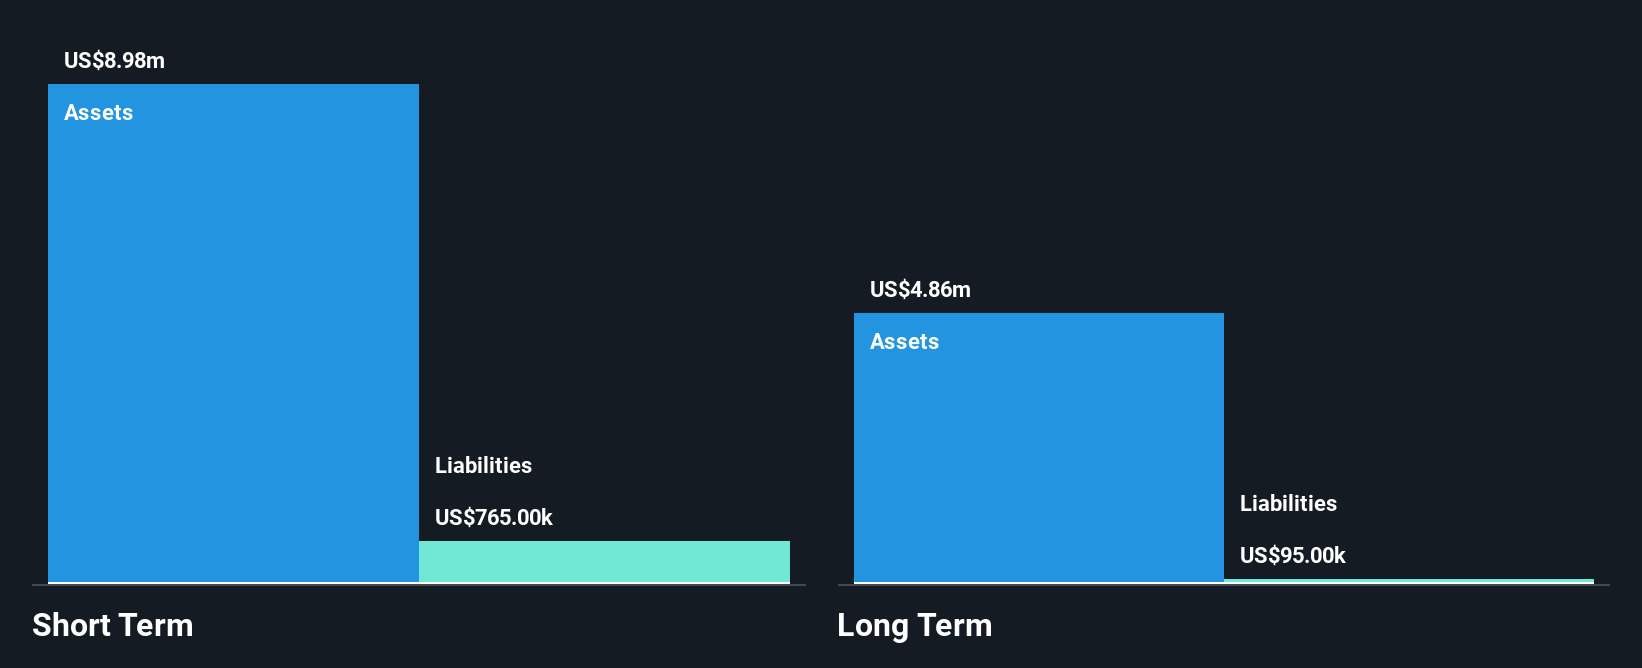
Hunter Group ASA, with a market cap of NOK141.30 million, operates in the oil tanker sector using VLCCs and recently reported positive earnings for Q2 2025, marking a shift from previous losses. Despite this improvement, the company remains pre-revenue with less than US$1 million in revenue annually. Hunter Group is debt-free and maintains strong short-term asset coverage over liabilities. However, it faces challenges typical of penny stocks such as high share price volatility and an inexperienced board with an average tenure of 2.5 years. Recent executive changes include CFO Lars Brynildsrud's resignation, impacting leadership stability.
- Navigate through the intricacies of Hunter Group with our comprehensive balance sheet health report here.
- Learn about Hunter Group's historical performance here.
Key Takeaways
- Click through to start exploring the rest of the 324 European Penny Stocks now.
- Want To Explore Some Alternatives? The end of cancer? These 29 emerging AI stocks are developing tech that will allow early idenification of life changing disesaes like cancer and Alzheimer's.
This article by Simply Wall St is general in nature. We provide commentary based on historical data and analyst forecasts only using an unbiased methodology and our articles are not intended to be financial advice. It does not constitute a recommendation to buy or sell any stock, and does not take account of your objectives, or your financial situation. We aim to bring you long-term focused analysis driven by fundamental data. Note that our analysis may not factor in the latest price-sensitive company announcements or qualitative material. Simply Wall St has no position in any stocks mentioned.
New: AI Stock Screener & Alerts
Our new AI Stock Screener scans the market every day to uncover opportunities.
• Dividend Powerhouses (3%+ Yield)
• Undervalued Small Caps with Insider Buying
• High growth Tech and AI Companies
Or build your own from over 50 metrics.
Have feedback on this article? Concerned about the content? Get in touch with us directly. Alternatively, email editorial-team@simplywallst.com
About BIT:CYB
Excellent balance sheet with reasonable growth potential.
Market Insights

Advertisement
Community Narratives
MINISO's fair value is projected at 26.69 with an anticipated PE ratio shift of 20x
Fair Value US$24.03|9.0% undervalued
BE
Community Contributor
Procter & Gamble: A Dividend Giant Facing Slowing Growth
Fair Value US$119.81|23.5% overvalued
AN
Community Contributor
Eli Lilly's Future Growth Driven by Tirzepatide and Favorable Market Conditions
Fair Value US$1.19k|14.4% undervalued
EA
Community Contributor