- Italy
- /
- Entertainment
- /
- BIT:JUVE
Juventus Football Club (BIT:JUVE investor five-year losses grow to 68% as the stock sheds €88m this past week

While it may not be enough for some shareholders, we think it is good to see the Juventus Football Club S.p.A. (BIT:JUVE) share price up 12% in a single quarter. But that doesn't change the fact that the returns over the last half decade have been disappointing. In fact, the share price has declined rather badly, down some 78% in that time. So we're hesitant to put much weight behind the short term increase. Of course, this could be the start of a turnaround.
With the stock having lost 7.7% in the past week, it's worth taking a look at business performance and seeing if there's any red flags.
View our latest analysis for Juventus Football Club
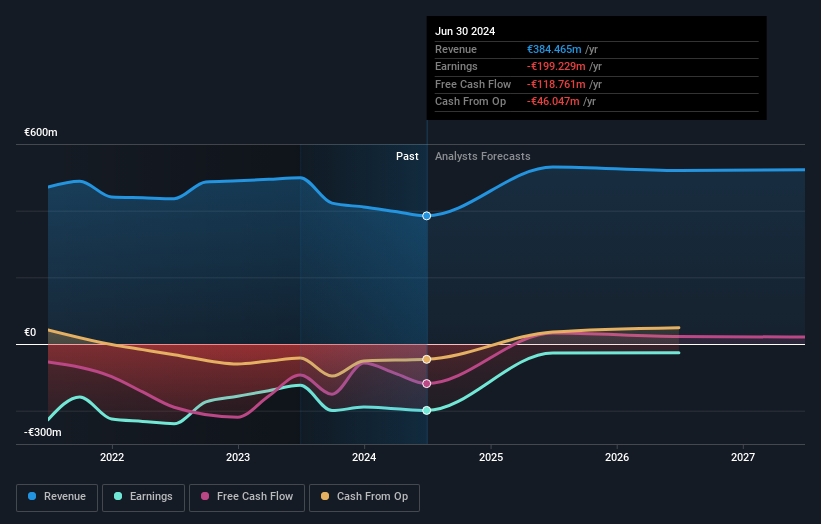
Given that Juventus Football Club didn't make a profit in the last twelve months, we'll focus on revenue growth to form a quick view of its business development. When a company doesn't make profits, we'd generally hope to see good revenue growth. That's because fast revenue growth can be easily extrapolated to forecast profits, often of considerable size.
Over half a decade Juventus Football Club reduced its trailing twelve month revenue by 8.1% for each year. That's not what investors generally want to see. The share price fall of 12% (per year, over five years) is a stern reminder that money-losing companies are expected to grow revenue. It takes a certain kind of mental fortitude (or recklessness) to buy shares in a company that loses money and doesn't grow revenue. Fear of becoming a 'bagholder' may be keeping people away from this stock.
The company's revenue and earnings (over time) are depicted in the image below (click to see the exact numbers).

Take a more thorough look at Juventus Football Club's financial health with this free report on its balance sheet.
What About The Total Shareholder Return (TSR)?
We'd be remiss not to mention the difference between Juventus Football Club's total shareholder return (TSR) and its share price return. Arguably the TSR is a more complete return calculation because it accounts for the value of dividends (as if they were reinvested), along with the hypothetical value of any discounted capital that have been offered to shareholders. We note that Juventus Football Club's TSR, at -68% is higher than its share price return of -78%. When you consider it hasn't been paying a dividend, this data suggests shareholders have benefitted from a spin-off, or had the opportunity to acquire attractively priced shares in a discounted capital raising.
A Different Perspective
It's nice to see that Juventus Football Club shareholders have received a total shareholder return of 28% over the last year. There's no doubt those recent returns are much better than the TSR loss of 11% per year over five years. This makes us a little wary, but the business might have turned around its fortunes. I find it very interesting to look at share price over the long term as a proxy for business performance. But to truly gain insight, we need to consider other information, too. Even so, be aware that Juventus Football Club is showing 4 warning signs in our investment analysis , you should know about...
Of course Juventus Football Club may not be the best stock to buy. So you may wish to see this free collection of growth stocks.
Please note, the market returns quoted in this article reflect the market weighted average returns of stocks that currently trade on Italian exchanges.
New: Manage All Your Stock Portfolios in One Place
We've created the ultimate portfolio companion for stock investors, and it's free.
• Connect an unlimited number of Portfolios and see your total in one currency
• Be alerted to new Warning Signs or Risks via email or mobile
• Track the Fair Value of your stocks
Have feedback on this article? Concerned about the content? Get in touch with us directly. Alternatively, email editorial-team (at) simplywallst.com.
This article by Simply Wall St is general in nature. We provide commentary based on historical data and analyst forecasts only using an unbiased methodology and our articles are not intended to be financial advice. It does not constitute a recommendation to buy or sell any stock, and does not take account of your objectives, or your financial situation. We aim to bring you long-term focused analysis driven by fundamental data. Note that our analysis may not factor in the latest price-sensitive company announcements or qualitative material. Simply Wall St has no position in any stocks mentioned.
About BIT:JUVE
Juventus Football Club
Operates as a professional football club in Italy.
Low and overvalued.
Similar Companies
Market Insights
Community Narratives


