Why Davide Campari-Milano S.p.A.'s (BIT:CPR) High P/E Ratio Isn't Necessarily A Bad Thing

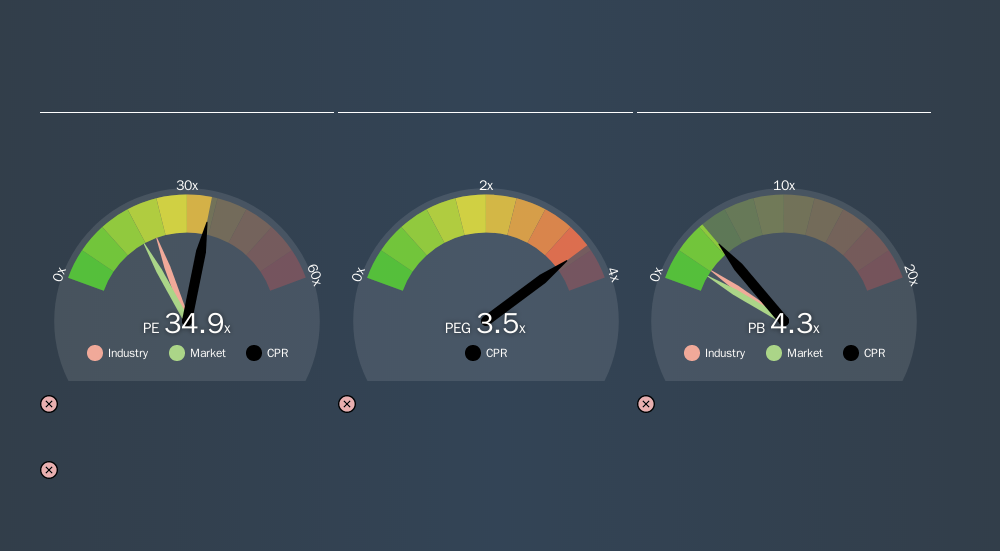
This article is for investors who would like to improve their understanding of price to earnings ratios (P/E ratios). We'll apply a basic P/E ratio analysis to Davide Campari-Milano S.p.A.'s (BIT:CPR), to help you decide if the stock is worth further research. What is Davide Campari-Milano's P/E ratio? Well, based on the last twelve months it is 34.91. That is equivalent to an earnings yield of about 2.9%.
Check out our latest analysis for Davide Campari-Milano
How Do I Calculate A Price To Earnings Ratio?
The formula for price to earnings is:
Price to Earnings Ratio = Share Price ÷ Earnings per Share (EPS)
Or for Davide Campari-Milano:
P/E of 34.91 = €8.28 ÷ €0.24 (Based on the trailing twelve months to June 2019.)
Is A High Price-to-Earnings Ratio Good?
A higher P/E ratio means that investors are paying a higher price for each €1 of company earnings. That isn't a good or a bad thing on its own, but a high P/E means that buyers have a higher opinion of the business's prospects, relative to stocks with a lower P/E.
Does Davide Campari-Milano Have A Relatively High Or Low P/E For Its Industry?
The P/E ratio indicates whether the market has higher or lower expectations of a company. You can see in the image below that the average P/E (21.4) for companies in the beverage industry is lower than Davide Campari-Milano's P/E.
Its relatively high P/E ratio indicates that Davide Campari-Milano shareholders think it will perform better than other companies in its industry classification. Shareholders are clearly optimistic, but the future is always uncertain. So investors should always consider the P/E ratio alongside other factors, such as whether company directors have been buying shares.
How Growth Rates Impact P/E Ratios
Probably the most important factor in determining what P/E a company trades on is the earnings growth. If earnings are growing quickly, then the 'E' in the equation will increase faster than it would otherwise. And in that case, the P/E ratio itself will drop rather quickly. So while a stock may look expensive based on past earnings, it could be cheap based on future earnings.
Davide Campari-Milano shrunk earnings per share by 33% over the last year. But EPS is up 13% over the last 5 years.
Don't Forget: The P/E Does Not Account For Debt or Bank Deposits
One drawback of using a P/E ratio is that it considers market capitalization, but not the balance sheet. That means it doesn't take debt or cash into account. Hypothetically, a company could reduce its future P/E ratio by spending its cash (or taking on debt) to achieve higher earnings.
Such spending might be good or bad, overall, but the key point here is that you need to look at debt to understand the P/E ratio in context.
Davide Campari-Milano's Balance Sheet
Davide Campari-Milano's net debt is 9.1% of its market cap. The market might award it a higher P/E ratio if it had net cash, but its unlikely this low level of net borrowing is having a big impact on the P/E multiple.
The Bottom Line On Davide Campari-Milano's P/E Ratio
Davide Campari-Milano's P/E is 34.9 which is above average (17.7) in its market. With modest debt but no EPS growth in the last year, it's fair to say the P/E implies some optimism about future earnings, from the market.
Investors have an opportunity when market expectations about a stock are wrong. If the reality for a company is better than it expects, you can make money by buying and holding for the long term. So this free report on the analyst consensus forecasts could help you make a master move on this stock.
Of course you might be able to find a better stock than Davide Campari-Milano. So you may wish to see this free collection of other companies that have grown earnings strongly.
If you spot an error that warrants correction, please contact the editor at editorial-team@simplywallst.com. This article by Simply Wall St is general in nature. It does not constitute a recommendation to buy or sell any stock, and does not take account of your objectives, or your financial situation. Simply Wall St has no position in the stocks mentioned.
We aim to bring you long-term focused research analysis driven by fundamental data. Note that our analysis may not factor in the latest price-sensitive company announcements or qualitative material. Thank you for reading.
About BIT:CPR
Davide Campari-Milano
Davide Campari-Milano N.V., together with its subsidiaries, markets and distributes alcoholic and non-alcoholic beverages in the Americas, the Middle East, Africa, Europe, and the Asia-Pacific.
Adequate balance sheet average dividend payer.
Market Insights

Weekly Picks

THE KINGDOM OF BROWN GOODS: WHY MGPI IS BEING CRUSHED BY INVENTORY & PRIMED FOR RESURRECTION


Why Vertical Aerospace (NYSE: EVTL) is Worth Possibly Over 13x its Current Price


The Quiet Giant That Became AI’s Power Grid
Recently Updated Narratives


MINISO's fair value is projected at 26.69 with an anticipated PE ratio shift of 20x

Fiverr International will transform the freelance industry with AI-powered growth

Stride Stock: Online Education Finds Its Second Act
Popular Narratives


MicroVision will explode future revenue by 380.37% with a vision towards success


Crazy Undervalued 42 Baggers Silver Play (Active & Running Mine)


