- Italy
- /
- Energy Services
- /
- BIT:SPM
Where Does Saipem Stand After Shares Rise 10% in a Month?

Reviewed by Bailey Pemberton
Trying to figure out what to do with Saipem stock? You are not alone. Whether you are a new investor or someone tracking your positions closely, there is plenty to unpack behind this company’s recent moves. In just the past month, Saipem shares have climbed 10.2%, adding to a huge 32.6% surge over the past year. Even after some bumps earlier this year, and a five-year performance still showing a loss of 30.8%, the stock has more than tripled (up 272.4%) in the last three years. Those kinds of swings tend to capture attention, especially as market sentiment shifts around energy and engineering stocks worldwide.
Much of this ride has been shaped by shifting market developments and changes in investor risk appetite. Saipem, known for its expertise in oil and gas engineering and infrastructure, has gained renewed interest from those betting on energy modernization and infrastructure upgrades across Europe. Recent market factors, like positive momentum in the energy sector and renewed confidence in capital spending on large projects, have helped drive up the share price. It is clear that investors have been reevaluating the company’s potential, and for good reason. When we put Saipem through our valuation checks, it scores a solid 5 out of 6 for being undervalued.
Of course, valuation is a complex story, and those scorecards are just the start. Next, we will dive into the major methods used to value a company like Saipem, and hint at an even more powerful approach to understanding whether this stock truly deserves a spot in your portfolio.
Approach 1: Saipem Discounted Cash Flow (DCF) Analysis
The Discounted Cash Flow (DCF) model estimates a company's intrinsic value by projecting its future cash flows and then discounting them back to today's value. This approach is popular because it focuses on the actual money a business is expected to generate over time, providing insight that cuts through short-term market noise.
For Saipem, the latest reported Free Cash Flow stands at €886.5 million. Analysts have estimated that these annual cash flows are set to grow steadily, with projections reaching €965.9 million in 2028 and €994 million by 2029. Beyond that, future estimates are extrapolated, showing continued but slower growth in the following years. All these figures remain comfortably below the €1 billion mark, and highlight a consistent upward trend.
Using a two-stage Free Cash Flow to Equity approach, the DCF valuation puts Saipem's fair value at €4.86 per share. At current share levels, this implies the stock is trading at a 48.5% discount to its intrinsic value, indicating it is significantly undervalued by this measure.
Result: UNDERVALUED
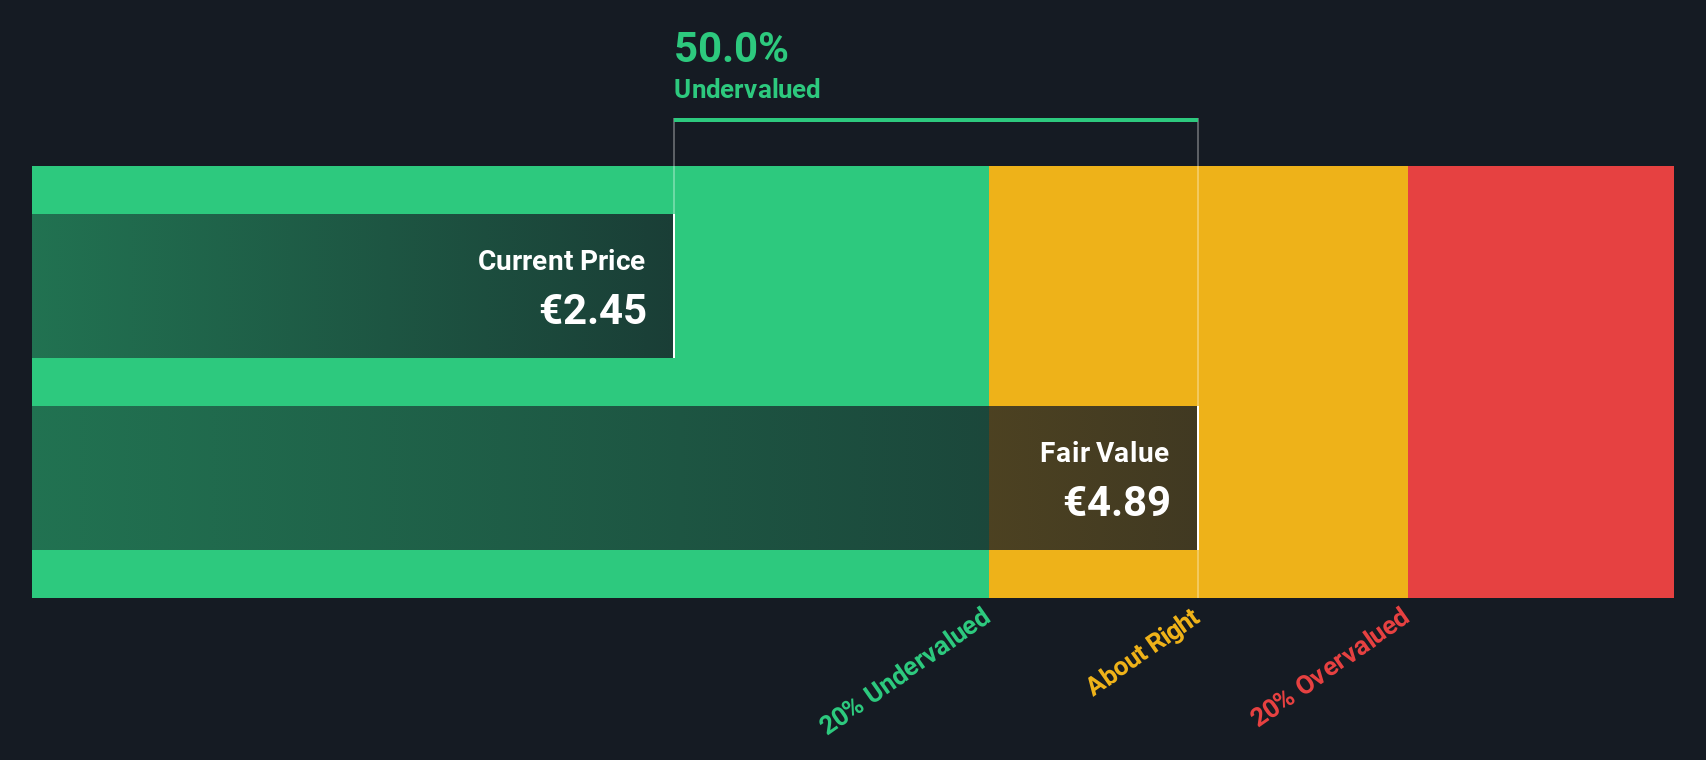
Our Discounted Cash Flow (DCF) analysis suggests Saipem is undervalued by 48.5%. Track this in your watchlist or portfolio, or discover more undervalued stocks.
Approach 2: Saipem Price vs Earnings (PE Ratio)
When it comes to valuing profitable companies like Saipem, the Price-to-Earnings (PE) ratio is a go-to metric. It tells you how much investors are willing to pay today for a euro of the company’s earnings. This ratio is especially useful for comparing companies within the same industry, as it reflects current profitability and market sentiment.
It is important to remember that a “normal” or “fair” PE ratio is not set in stone. Expectations for future growth and perceived risks can have a big impact. Fast-growing, stable companies tend to trade at higher multiples, while firms with uncertain prospects or more risk command lower ones.
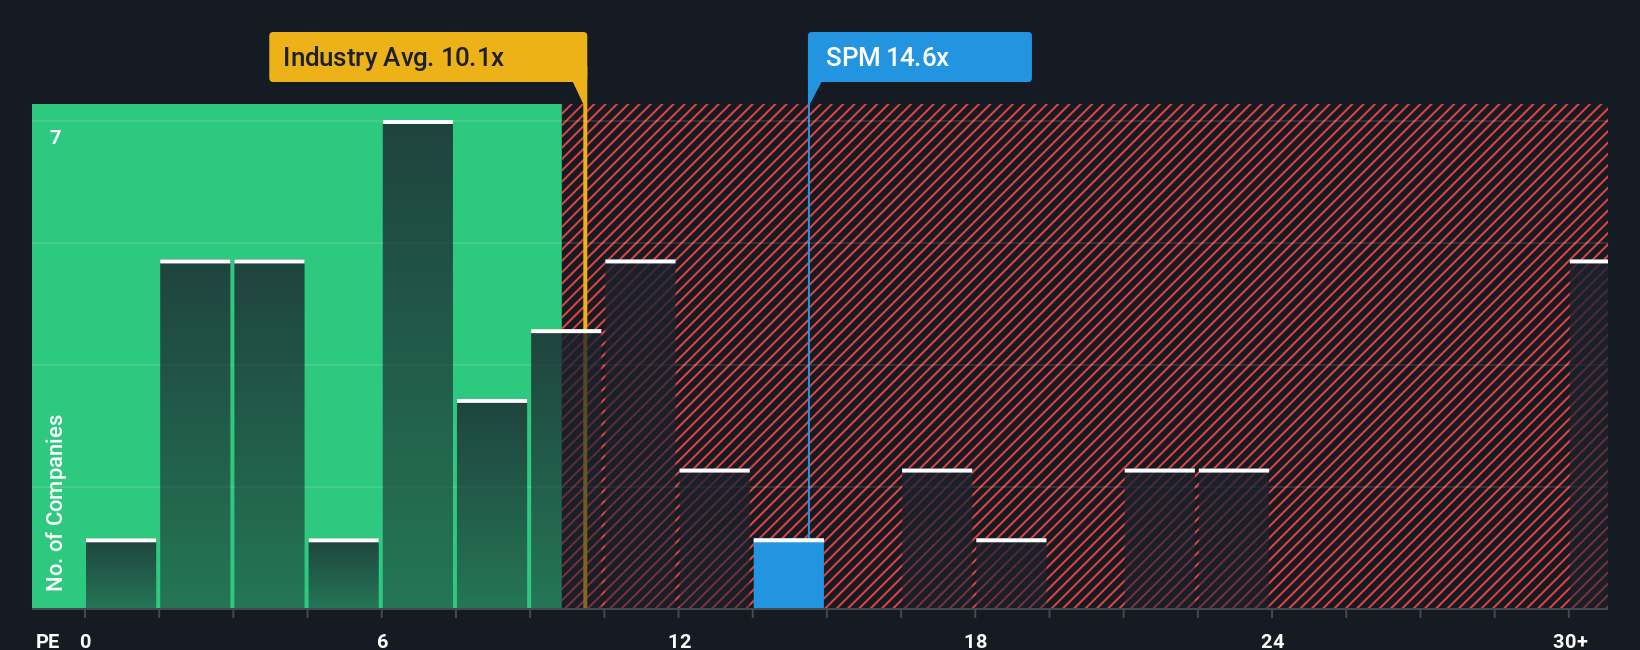
Right now, Saipem trades on a PE of 14.9x. That is just above the Energy Services industry average, which sits at 14.1x, and notably below its peer group average of 20.7x. On the surface, this might suggest Saipem is priced conservatively compared to similar firms.
This is where Simply Wall St’s “Fair Ratio” comes in. The Fair Ratio estimates what Saipem’s PE should be, factoring in not just industry or peer comparisons but also growth forecasts, profit margins, risk profiles, and the company’s overall market positioning. Unlike raw industry averages, this makes the Fair Ratio a more tailored benchmark for fair value.
For Saipem, the Fair Ratio is calculated at 16.1x. With Saipem’s current market PE ratio at 14.9x, this points to the shares being slightly undervalued compared to what would be considered a fair price given all relevant factors.
Result: UNDERVALUED
PE ratios tell one story, but what if the real opportunity lies elsewhere? Discover companies where insiders are betting big on explosive growth.
Upgrade Your Decision Making: Choose your Saipem Narrative
Earlier, we hinted at a smarter way to approach valuation. Enter Narratives. A Narrative is simply your story about a company, connecting your perspective on Saipem’s future with the numbers you believe matter most, like expected earnings, margins, and ultimately, what you think the stock is fairly worth.
Unlike traditional ratios or static analysis, Narratives bring investing to life by linking Saipem’s business outlook and your assumptions directly to financial forecasts and a tailored fair value. On Simply Wall St's Community page, millions of investors build and share their own Narratives, making it easy to see how your views stack up against others in real time.
With Narratives, you can quickly decide whether to buy, sell, or hold, as each Narrative clearly shows a fair value target compared to the latest share price. In addition, as new news or earnings update your chosen Narrative instantly, you always have a living perspective based on the freshest information.
For example, some investors’ Narratives for Saipem are optimistic, pointing to a best-case price target of €3.54, while others are more cautious, forecasting just €2.00, so you can compare these stories and follow the one that fits your own outlook best.
Do you think there's more to the story for Saipem? Create your own Narrative to let the Community know!

This article by Simply Wall St is general in nature. We provide commentary based on historical data and analyst forecasts only using an unbiased methodology and our articles are not intended to be financial advice. It does not constitute a recommendation to buy or sell any stock, and does not take account of your objectives, or your financial situation. We aim to bring you long-term focused analysis driven by fundamental data. Note that our analysis may not factor in the latest price-sensitive company announcements or qualitative material. Simply Wall St has no position in any stocks mentioned.
The New Payments ETF Is Live on NASDAQ:
Money is moving to real-time rails, and a newly listed ETF now gives investors direct exposure. Fast settlement. Institutional custody. Simple access.
Explore how this launch could reshape portfolios
Sponsored ContentNew: Manage All Your Stock Portfolios in One Place
We've created the ultimate portfolio companion for stock investors, and it's free.
• Connect an unlimited number of Portfolios and see your total in one currency
• Be alerted to new Warning Signs or Risks via email or mobile
• Track the Fair Value of your stocks
Have feedback on this article? Concerned about the content? Get in touch with us directly. Alternatively, email editorial-team@simplywallst.com
About BIT:SPM
Undervalued with adequate balance sheet.
Similar Companies
Market Insights

Weekly Picks

THE KINGDOM OF BROWN GOODS: WHY MGPI IS BEING CRUSHED BY INVENTORY & PRIMED FOR RESURRECTION


Why Vertical Aerospace (NYSE: EVTL) is Worth Possibly Over 13x its Current Price


The Quiet Giant That Became AI’s Power Grid
Recently Updated Narratives

Cheap if able to sustain revenue, and a potential bargain if able to turn store openings into revenue growth

Butler National (Buks) outperforms.


A tech powerhouse quietly powering the world’s AI infrastructure.
Popular Narratives


MicroVision will explode future revenue by 380.37% with a vision towards success


Crazy Undervalued 42 Baggers Silver Play (Active & Running Mine)


