
Advertisement
Eni S.p.A. (BIT:ENI), a large-cap worth €54b, comes to mind for investors seeking a strong and reliable stock investment. Doing business globally, large caps tend to have diversified revenue streams and attractive capital returns, making them desirable investments for risk-averse portfolios. But, the key to their continued success lies in its financial health. This article will examine Eni’s financial liquidity and debt levels to get an idea of whether the company can deal with cyclical downturns and maintain funds to accommodate strategic spending for future growth. Note that this information is centred entirely on financial health and is a high-level overview, so I encourage you to look further into ENI here.
Check out our latest analysis for Eni
Does ENI Produce Much Cash Relative To Its Debt?
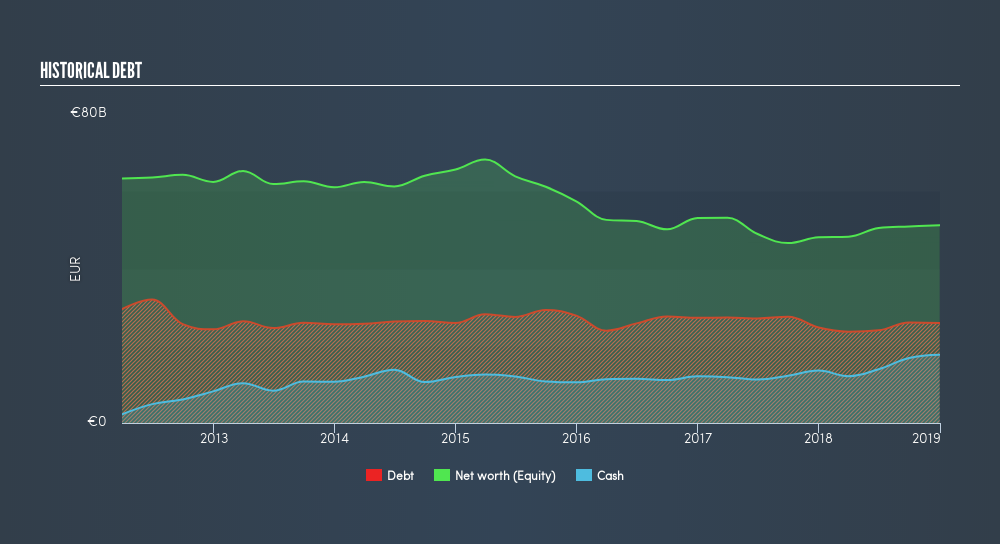
ENI's debt level has been constant at around €26b over the previous year which accounts for long term debt. At this current level of debt, the current cash and short-term investment levels stands at €18b to keep the business going. Moreover, ENI has generated €14b in operating cash flow in the last twelve months, leading to an operating cash to total debt ratio of 53%, meaning that ENI’s debt is appropriately covered by operating cash.
Can ENI meet its short-term obligations with the cash in hand?
Looking at ENI’s €28b in current liabilities, it seems that the business has been able to meet these commitments with a current assets level of €39b, leading to a 1.39x current account ratio. The current ratio is the number you get when you divide current assets by current liabilities. Usually, for Oil and Gas companies, this is a suitable ratio since there's a sufficient cash cushion without leaving too much capital idle or in low-earning investments.
Can ENI service its debt comfortably?
With a debt-to-equity ratio of 51%, ENI can be considered as an above-average leveraged company. This is not unusual for large-caps since debt tends to be less expensive than equity because interest payments are tax deductible. Consequently, larger-cap organisations tend to enjoy lower cost of capital as a result of easily attained financing, providing an advantage over smaller companies.
Next Steps:
Although ENI’s debt level is towards the higher end of the spectrum, its cash flow coverage seems adequate to meet obligations which means its debt is being efficiently utilised. This may mean this is an optimal capital structure for the business, given that it is also meeting its short-term commitment. This is only a rough assessment of financial health, and I'm sure ENI has company-specific issues impacting its capital structure decisions. You should continue to research Eni to get a more holistic view of the large-cap by looking at:
- Future Outlook: What are well-informed industry analysts predicting for ENI’s future growth? Take a look at our free research report of analyst consensus for ENI’s outlook.
- Valuation: What is ENI worth today? Is the stock undervalued, even when its growth outlook is factored into its intrinsic value? The intrinsic value infographic in our free research report helps visualize whether ENI is currently mispriced by the market.
- Other High-Performing Stocks: Are there other stocks that provide better prospects with proven track records? Explore our free list of these great stocks here.
We aim to bring you long-term focused research analysis driven by fundamental data. Note that our analysis may not factor in the latest price-sensitive company announcements or qualitative material.
If you spot an error that warrants correction, please contact the editor at editorial-team@simplywallst.com. This article by Simply Wall St is general in nature. It does not constitute a recommendation to buy or sell any stock, and does not take account of your objectives, or your financial situation. Simply Wall St has no position in the stocks mentioned. Thank you for reading.
About BIT:ENI
Eni
Operates as an integrated energy company in Italy, Other European Union, Rest of Europe, the United States, Asia, Africa, and internationally.
Excellent balance sheet second-rate dividend payer.
Similar Companies
Market Insights


Advertisement
Community Narratives
For the Emperor: Why Games Workshop Could Be a Star Investment
Fair Value UK£160.00|0.4% overvalued
RO
Community Contributor
Securitas will boost margins with AI and tech-driven services
Fair Value SEK 260.91|44.5% undervalued
UN
Community Contributor
A Leader in EV Charging with Growth Potential
Fair Value €27.00|17.8% undervalued
TI
Community Contributor