
Advertisement
- Italy
- /
- Oil and Gas
- /
- BIT:ENI
Does The Hype Around Eni S.p.A.'s (BIT:ENI) Growth Justify Its April Share Price?
Eni S.p.A. (BIT:ENI) is considered a high-growth stock, but its last closing price of €15.888 left some investors wondering if this high future earnings potential can be rationalized by its current price tag. Let’s take a look at some key metrics to determine whether there's any value here for current and potential future investors.
Check out our latest analysis for Eni
Where's the growth?
Investors in Eni have been patiently waiting for the uptick in earnings. If you believe the analysts covering the stock then the following year will be very interesting. Expectations from 24 analysts are bullish with earnings forecasted to rise significantly from today's level of €1.146 to €1.615 over the next three years. On average, this leads to a growth rate of 10% each year, which indicates a solid future in the near term.Is ENI available at a good price after accounting for its growth?
Eni is trading at quite low price-to-earnings (PE) ratio of 13.87x. This tells us the stock is undervalued relative to the current IT market average of 16.06x , and overvalued based on current earnings compared to the Oil and Gas industry average of 10.39x .
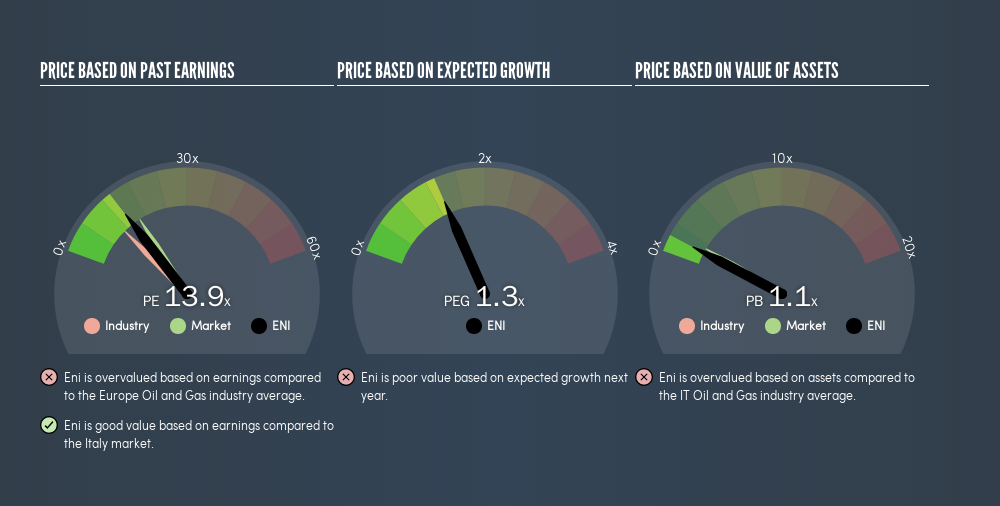
We already know that ENI appears to be overvalued when compared to its industry average. However, seeing as Eni is perceived as a high-growth stock, we must also account for its earnings growth, which is captured in the PEG ratio. A PE ratio of 13.87x and expected year-on-year earnings growth of 10% give Eni a higher PEG ratio of 1.32x. This means that, when we account for Eni's growth, the stock can be viewed as slightly overvalued , based on its fundamentals.
What this means for you:
ENI's current overvaluation could signal a potential selling opportunity to reduce your exposure to the stock, or it you're a potential investor, now may not be the right time to buy. However, basing your investment decision off one metric alone is certainly not sufficient. There are many things I have not taken into account in this article and the PEG ratio is very one-dimensional. If you have not done so already, I highly recommend you to complete your research by taking a look at the following:
- Financial Health: Are ENI’s operations financially sustainable? Balance sheets can be hard to analyze, which is why we’ve done it for you. Check out our financial health checks here.
- Past Track Record: Has ENI been consistently performing well irrespective of the ups and downs in the market? Go into more detail in the past performance analysis and take a look at the free visual representations of ENI's historicals for more clarity.
- Other High-Performing Stocks: Are there other stocks that provide better prospects with proven track records? Explore our free list of these great stocks here.
We aim to bring you long-term focused research analysis driven by fundamental data. Note that our analysis may not factor in the latest price-sensitive company announcements or qualitative material.
If you spot an error that warrants correction, please contact the editor at editorial-team@simplywallst.com. This article by Simply Wall St is general in nature. It does not constitute a recommendation to buy or sell any stock, and does not take account of your objectives, or your financial situation. Simply Wall St has no position in the stocks mentioned. Thank you for reading.
About BIT:ENI
Eni
Operates as an integrated energy company in Italy, Other European Union, Rest of Europe, the United States, Asia, Africa, and internationally.
Excellent balance sheet second-rate dividend payer.
Similar Companies
Market Insights

Advertisement
Community Narratives
Finding The True Value Of A Logistics Powerhouse
Fair Value US$95.21|8.5% undervalued
NV
Community Contributor
Paradigm Biopharmaceuticals Will Lead Osteoarthritis Treatment with Zilosul's FDA Success
Fair Value AU$5.50|91.8% undervalued
AM
Community Contributor
Barrick Mining (ABX:CA): A Gold Hedge against a U.S. Shutdown
Fair Value CA$60.00|26.5% undervalued
GM
Community Contributor