
Advertisement
- Italy
- /
- Hospitality
- /
- BIT:LON
Revenues Not Telling The Story For Longino & Cardenal S.p.A. (BIT:LON) After Shares Rise 33%
Longino & Cardenal S.p.A. (BIT:LON) shares have had a really impressive month, gaining 33% after a shaky period beforehand. The bad news is that even after the stocks recovery in the last 30 days, shareholders are still underwater by about 7.9% over the last year.
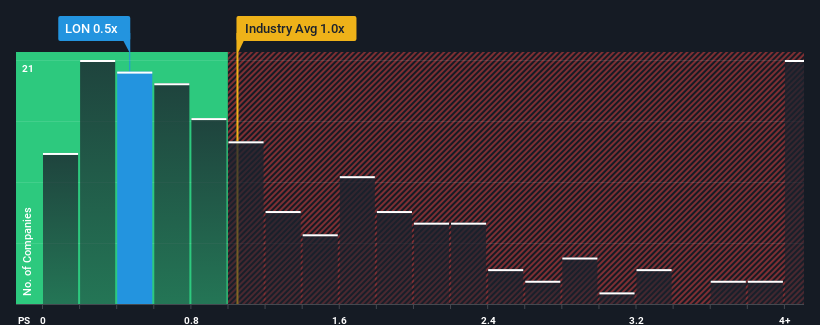
Even after such a large jump in price, it's still not a stretch to say that Longino & Cardenal's price-to-sales (or "P/S") ratio of 0.5x right now seems quite "middle-of-the-road" compared to the Hospitality industry in Italy, where the median P/S ratio is around 0.6x. Although, it's not wise to simply ignore the P/S without explanation as investors may be disregarding a distinct opportunity or a costly mistake.
See our latest analysis for Longino & Cardenal
What Does Longino & Cardenal's P/S Mean For Shareholders?
Longino & Cardenal could be doing better as it's been growing revenue less than most other companies lately. One possibility is that the P/S ratio is moderate because investors think this lacklustre revenue performance will turn around. However, if this isn't the case, investors might get caught out paying too much for the stock.
Want the full picture on analyst estimates for the company? Then our free report on Longino & Cardenal will help you uncover what's on the horizon.What Are Revenue Growth Metrics Telling Us About The P/S?
The only time you'd be comfortable seeing a P/S like Longino & Cardenal's is when the company's growth is tracking the industry closely.
Retrospectively, the last year delivered a decent 8.3% gain to the company's revenues. Pleasingly, revenue has also lifted 33% in aggregate from three years ago, partly thanks to the last 12 months of growth. So we can start by confirming that the company has done a great job of growing revenues over that time.
Looking ahead now, revenue is anticipated to climb by 14% each year during the coming three years according to the three analysts following the company. That's shaping up to be materially lower than the 84% per year growth forecast for the broader industry.
With this in mind, we find it intriguing that Longino & Cardenal's P/S is closely matching its industry peers. It seems most investors are ignoring the fairly limited growth expectations and are willing to pay up for exposure to the stock. Maintaining these prices will be difficult to achieve as this level of revenue growth is likely to weigh down the shares eventually.
What We Can Learn From Longino & Cardenal's P/S?
Longino & Cardenal's stock has a lot of momentum behind it lately, which has brought its P/S level with the rest of the industry. We'd say the price-to-sales ratio's power isn't primarily as a valuation instrument but rather to gauge current investor sentiment and future expectations.
When you consider that Longino & Cardenal's revenue growth estimates are fairly muted compared to the broader industry, it's easy to see why we consider it unexpected to be trading at its current P/S ratio. When we see companies with a relatively weaker revenue outlook compared to the industry, we suspect the share price is at risk of declining, sending the moderate P/S lower. Circumstances like this present a risk to current and prospective investors who may see share prices fall if the low revenue growth impacts the sentiment.
It's always necessary to consider the ever-present spectre of investment risk. We've identified 2 warning signs with Longino & Cardenal, and understanding them should be part of your investment process.
It's important to make sure you look for a great company, not just the first idea you come across. So if growing profitability aligns with your idea of a great company, take a peek at this free list of interesting companies with strong recent earnings growth (and a low P/E).
New: AI Stock Screener & Alerts
Our new AI Stock Screener scans the market every day to uncover opportunities.
• Dividend Powerhouses (3%+ Yield)
• Undervalued Small Caps with Insider Buying
• High growth Tech and AI Companies
Or build your own from over 50 metrics.
Have feedback on this article? Concerned about the content? Get in touch with us directly. Alternatively, email editorial-team (at) simplywallst.com.
This article by Simply Wall St is general in nature. We provide commentary based on historical data and analyst forecasts only using an unbiased methodology and our articles are not intended to be financial advice. It does not constitute a recommendation to buy or sell any stock, and does not take account of your objectives, or your financial situation. We aim to bring you long-term focused analysis driven by fundamental data. Note that our analysis may not factor in the latest price-sensitive company announcements or qualitative material. Simply Wall St has no position in any stocks mentioned.
About BIT:LON
Longino & Cardenal
Provides catering services to the hotel, restaurant, catering, and gastronomy sectors in Italy, rest of the European Union, and internationally.
Undervalued with adequate balance sheet.
Market Insights

Advertisement
Community Narratives
MicroVision will explode future revenue by 380.37% with a vision towards success
Fair Value US$60|98.4% undervalued
TH
Community Contributor
The Indispensable Artery for a New North American Economy
Fair Value CA$132.87|0.7% overvalued
TI
Community Contributor
Recently Updated Narratives
PO

PortfolioPlus on Bisalloy Steel Group ·
Bisalloy Steel Group will shine with a projected profit margin increase of 12.8%
Fair Value:AU$6.7118.0% undervalued
2 followersusers have followed this narrative
0 commentsusers have commented on this narrative
0 likesusers have liked this narrative
CO

composite32 on Astor Enerji ·
Astor Enerji will surge with a fair value of $140.43 in the next 3 years
Fair Value:₺140.4335.5% undervalued
1 followerusers have followed this narrative
0 commentsusers have commented on this narrative
0 likesusers have liked this narrative
RE

RecMag on Proximus ·
Proximus: The State-Backed Backup Plan with 7% Gross Yield and 15% Currency Upside.
Fair Value:€17.1356.7% undervalued
31 followersusers have followed this narrative
0 commentsusers have commented on this narrative
0 likesusers have liked this narrative
Popular Narratives
TH

TheWallstreetKing on MicroVision ·
MicroVision will explode future revenue by 380.37% with a vision towards success
Fair Value:US$6098.4% undervalued
101 followersusers have followed this narrative
10 commentsusers have commented on this narrative
20 likesusers have liked this narrative
AN


AnalystConsensusTarget on NVIDIA ·
NVDA: Expanding AI Demand Will Drive Major Data Center Investments Through 2026
Fair Value:US$250.3929.3% undervalued
933 followersusers have followed this narrative
6 commentsusers have commented on this narrative
23 likesusers have liked this narrative
OS


oscargarcia on Alphabet ·
The company that turned a verb into a global necessity and basically runs the modern internet, digital ads, smartphones, maps, and AI.
Fair Value:US$3405.8% undervalued
140 followersusers have followed this narrative
6 commentsusers have commented on this narrative
18 likesusers have liked this narrative