

One of the best investments we can make is in our own knowledge and skill set. With that in mind, this article will work through how we can use Return On Equity (ROE) to better understand a business. By way of learning-by-doing, we'll look at ROE to gain a better understanding of MARR S.p.A. (BIT:MARR).
Return on equity or ROE is an important factor to be considered by a shareholder because it tells them how effectively their capital is being reinvested. In other words, it is a profitability ratio which measures the rate of return on the capital provided by the company's shareholders.
Check out our latest analysis for MARR
How Is ROE Calculated?
The formula for return on equity is:
Return on Equity = Net Profit (from continuing operations) ÷ Shareholders' Equity
So, based on the above formula, the ROE for MARR is:
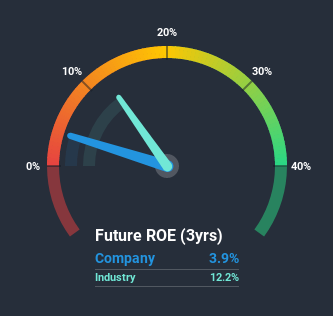
3.9% = €13m ÷ €327m (Based on the trailing twelve months to September 2020).
The 'return' is the profit over the last twelve months. So, this means that for every €1 of its shareholder's investments, the company generates a profit of €0.04.
Does MARR Have A Good Return On Equity?
By comparing a company's ROE with its industry average, we can get a quick measure of how good it is. Importantly, this is far from a perfect measure, because companies differ significantly within the same industry classification. As shown in the graphic below, MARR has a lower ROE than the average (12%) in the Consumer Retailing industry classification.
Unfortunately, that's sub-optimal. Although, we think that a lower ROE could still mean that a company has the opportunity to better its returns with the use of leverage, provided its existing debt levels are low. A company with high debt levels and low ROE is a combination we like to avoid given the risk involved. Our risks dashboard should have the 4 risks we have identified for MARR.
How Does Debt Impact Return On Equity?
Most companies need money -- from somewhere -- to grow their profits. That cash can come from issuing shares, retained earnings, or debt. In the case of the first and second options, the ROE will reflect this use of cash, for growth. In the latter case, the use of debt will improve the returns, but will not change the equity. That will make the ROE look better than if no debt was used.
MARR's Debt And Its 3.9% ROE
MARR clearly uses a high amount of debt to boost returns, as it has a debt to equity ratio of 1.27. Its ROE is quite low, even with the use of significant debt; that's not a good result, in our opinion. Investors should think carefully about how a company might perform if it was unable to borrow so easily, because credit markets do change over time.
Summary
Return on equity is a useful indicator of the ability of a business to generate profits and return them to shareholders. In our books, the highest quality companies have high return on equity, despite low debt. All else being equal, a higher ROE is better.
But when a business is high quality, the market often bids it up to a price that reflects this. Profit growth rates, versus the expectations reflected in the price of the stock, are a particularly important to consider. So I think it may be worth checking this free report on analyst forecasts for the company.
Of course MARR may not be the best stock to buy. So you may wish to see this free collection of other companies that have high ROE and low debt.
If you decide to trade MARR, use the lowest-cost* platform that is rated #1 Overall by Barron’s, Interactive Brokers. Trade stocks, options, futures, forex, bonds and funds on 135 markets, all from a single integrated account. Promoted
New: Manage All Your Stock Portfolios in One Place
We've created the ultimate portfolio companion for stock investors, and it's free.
• Connect an unlimited number of Portfolios and see your total in one currency
• Be alerted to new Warning Signs or Risks via email or mobile
• Track the Fair Value of your stocks
This article by Simply Wall St is general in nature. It does not constitute a recommendation to buy or sell any stock, and does not take account of your objectives, or your financial situation. We aim to bring you long-term focused analysis driven by fundamental data. Note that our analysis may not factor in the latest price-sensitive company announcements or qualitative material. Simply Wall St has no position in any stocks mentioned.
*Interactive Brokers Rated Lowest Cost Broker by StockBrokers.com Annual Online Review 2020
Have feedback on this article? Concerned about the content? Get in touch with us directly. Alternatively, email editorial-team@simplywallst.com.
About BIT:MARR
MARR
Engages in marketing and distribution of fresh, dried, and frozen food products for catering in Italy, the European Union, and internationally.
Flawless balance sheet, undervalued and pays a dividend.

