
Advertisement
If You Had Bought CSP International Fashion Group (BIT:CSP) Stock Five Years Ago, You'd Be Sitting On A 59% Loss, Today

Statistically speaking, long term investing is a profitable endeavour. But no-one is immune from buying too high. For example the CSP International Fashion Group S.p.A. (BIT:CSP) share price dropped 59% over five years. We certainly feel for shareholders who bought near the top. And it's not just long term holders hurting, because the stock is down 26% in the last year. The good news is that the stock is up 3.2% in the last week.
View 3 warning signs we detected for CSP International Fashion Group
There is no denying that markets are sometimes efficient, but prices do not always reflect underlying business performance. One flawed but reasonable way to assess how sentiment around a company has changed is to compare the earnings per share (EPS) with the share price.
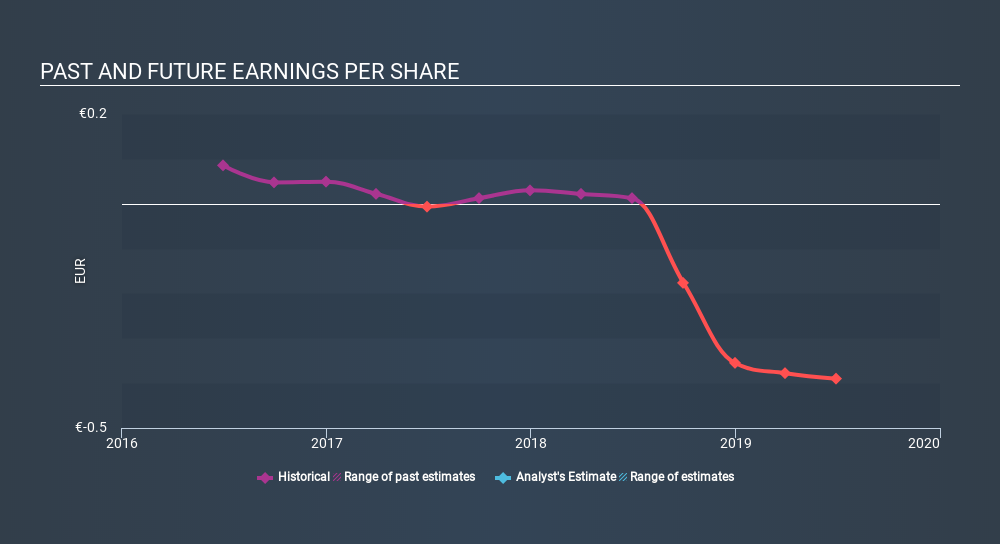
In the last half decade CSP International Fashion Group saw its share price fall as its EPS declined below zero. At present it's hard to make valid comparisons between EPS and the share price. But we would generally expect a lower price, given the situation.
The image below shows how EPS has tracked over time (if you click on the image you can see greater detail).
This free interactive report on CSP International Fashion Group's earnings, revenue and cash flow is a great place to start, if you want to investigate the stock further.
What About Dividends?
As well as measuring the share price return, investors should also consider the total shareholder return (TSR). Whereas the share price return only reflects the change in the share price, the TSR includes the value of dividends (assuming they were reinvested) and the benefit of any discounted capital raising or spin-off. Arguably, the TSR gives a more comprehensive picture of the return generated by a stock. We note that for CSP International Fashion Group the TSR over the last 5 years was -52%, which is better than the share price return mentioned above. And there's no prize for guessing that the dividend payments largely explain the divergence!
A Different Perspective
CSP International Fashion Group shareholders are down 26% for the year (even including dividends) , but the market itself is up 27%. However, keep in mind that even the best stocks will sometimes underperform the market over a twelve month period. Unfortunately, last year's performance may indicate unresolved challenges, given that it was worse than the annualised loss of 14% over the last half decade. We realise that Buffett has said investors should 'buy when there is blood on the streets', but we caution that investors should first be sure they are buying a high quality businesses. Keeping this in mind, a solid next step might be to take a look at CSP International Fashion Group's dividend track record. This free interactive graph is a great place to start.
If you would prefer to check out another company -- one with potentially superior financials -- then do not miss this free list of companies that have proven they can grow earnings.
Please note, the market returns quoted in this article reflect the market weighted average returns of stocks that currently trade on IT exchanges.
If you spot an error that warrants correction, please contact the editor at editorial-team@simplywallst.com. This article by Simply Wall St is general in nature. It does not constitute a recommendation to buy or sell any stock, and does not take account of your objectives, or your financial situation. Simply Wall St has no position in the stocks mentioned.
We aim to bring you long-term focused research analysis driven by fundamental data. Note that our analysis may not factor in the latest price-sensitive company announcements or qualitative material. Thank you for reading.
About BIT:CSP
CSP International Fashion Group
Produces and sells hosiery and underwear in Italy, France, European Union, and internationally.
Flawless balance sheet and good value.
Market Insights


Advertisement
Community Narratives
The Future of Drug Testing? Fingerprint Tech Shows Serious Promise
Fair Value US$2.98|40.3% undervalued
JO
Community Contributor
Suncorp’s Next Chapter: Insurance-Only and Ready to Grow
Fair Value AU$22.83|7.9% undervalued
RO
Community Contributor
Thyssenkrupp Nucera Will Achieve Double-Digit Profits by 2030 Boosted by Hydrogen Growth
Fair Value €14.40|31.6% undervalued
CH
Community Contributor
Tesla’s Nvidia Moment – The AI & Robotics Inflection Point
Fair Value US$359.72|12.3% undervalued
BL
Community Contributor