- Italy
- /
- Construction
- /
- BIT:SCF
Investors one-year returns in Salcef Group (BIT:SCF) have grown faster than the company's underlying earnings growth


Unfortunately, investing is risky - companies can and do go bankrupt. But when you pick a company that is really flourishing, you can make more than 100%. For example, the Salcef Group S.p.A. (BIT:SCF) share price has soared 101% in the last 1 year. Most would be very happy with that, especially in just one year! On top of that, the share price is up 26% in about a quarter. We'll need to follow Salcef Group for a while to get a better sense of its share price trend, since it hasn't been listed for particularly long.
In light of the stock dropping 5.3% in the past week, we want to investigate the longer term story, and see if fundamentals have been the driver of the company's positive one-year return.
See our latest analysis for Salcef Group
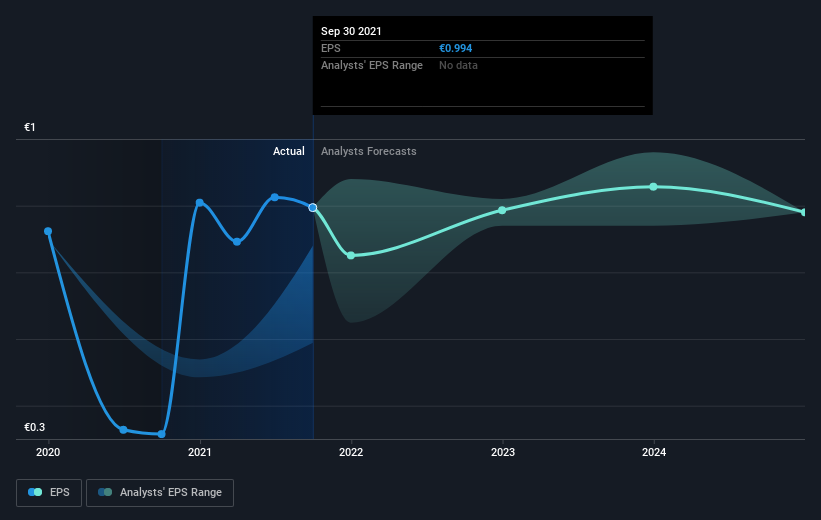
To quote Buffett, 'Ships will sail around the world but the Flat Earth Society will flourish. There will continue to be wide discrepancies between price and value in the marketplace...' One way to examine how market sentiment has changed over time is to look at the interaction between a company's share price and its earnings per share (EPS).
During the last year Salcef Group grew its earnings per share (EPS) by 216%. It's fair to say that the share price gain of 101% did not keep pace with the EPS growth. Therefore, it seems the market isn't as excited about Salcef Group as it was before. This could be an opportunity.
You can see how EPS has changed over time in the image below (click on the chart to see the exact values).
We know that Salcef Group has improved its bottom line lately, but is it going to grow revenue? You could check out this free report showing analyst revenue forecasts.
What About Dividends?
It is important to consider the total shareholder return, as well as the share price return, for any given stock. Whereas the share price return only reflects the change in the share price, the TSR includes the value of dividends (assuming they were reinvested) and the benefit of any discounted capital raising or spin-off. So for companies that pay a generous dividend, the TSR is often a lot higher than the share price return. As it happens, Salcef Group's TSR for the last 1 year was 107%, which exceeds the share price return mentioned earlier. And there's no prize for guessing that the dividend payments largely explain the divergence!
A Different Perspective
It's nice to see that Salcef Group shareholders have gained 107% over the last year, including dividends. A substantial portion of that gain has come in the last three months, with the stock up 26% in that time. Demand for the stock from multiple parties is pushing the price higher; it could be that word is getting out about its virtues as a business. It's always interesting to track share price performance over the longer term. But to understand Salcef Group better, we need to consider many other factors. For instance, we've identified 2 warning signs for Salcef Group that you should be aware of.
Of course, you might find a fantastic investment by looking elsewhere. So take a peek at this free list of companies we expect will grow earnings.
Please note, the market returns quoted in this article reflect the market weighted average returns of stocks that currently trade on IT exchanges.
If you're looking to trade Salcef Group, open an account with the lowest-cost platform trusted by professionals, Interactive Brokers.
With clients in over 200 countries and territories, and access to 160 markets, IBKR lets you trade stocks, options, futures, forex, bonds and funds from a single integrated account.
Enjoy no hidden fees, no account minimums, and FX conversion rates as low as 0.03%, far better than what most brokers offer.
Sponsored ContentNew: Manage All Your Stock Portfolios in One Place
We've created the ultimate portfolio companion for stock investors, and it's free.
• Connect an unlimited number of Portfolios and see your total in one currency
• Be alerted to new Warning Signs or Risks via email or mobile
• Track the Fair Value of your stocks
Have feedback on this article? Concerned about the content? Get in touch with us directly. Alternatively, email editorial-team (at) simplywallst.com.
This article by Simply Wall St is general in nature. We provide commentary based on historical data and analyst forecasts only using an unbiased methodology and our articles are not intended to be financial advice. It does not constitute a recommendation to buy or sell any stock, and does not take account of your objectives, or your financial situation. We aim to bring you long-term focused analysis driven by fundamental data. Note that our analysis may not factor in the latest price-sensitive company announcements or qualitative material. Simply Wall St has no position in any stocks mentioned.
About BIT:SCF
Salcef Group
Designs, constructs, and maintains railway infrastructure and civil works worldwide.
Excellent balance sheet with reasonable growth potential.
Market Insights

Community Narratives

