
Advertisement
Further Upside For Fidia S.p.A. (BIT:FDA) Shares Could Introduce Price Risks After 28% Bounce
Fidia S.p.A. (BIT:FDA) shares have continued their recent momentum with a 28% gain in the last month alone. Still, the 30-day jump doesn't change the fact that longer term shareholders have seen their stock decimated by the 51% share price drop in the last twelve months.
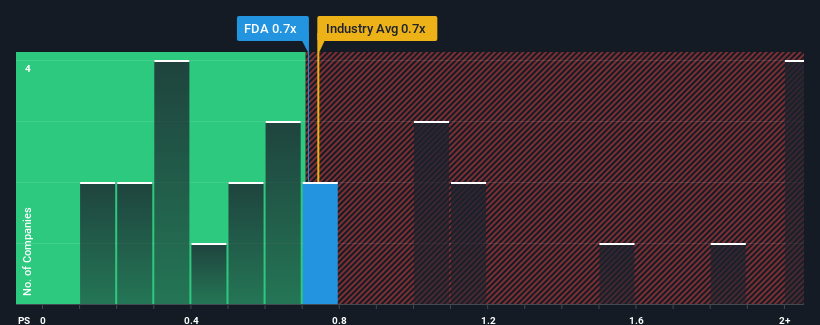
In spite of the firm bounce in price, it's still not a stretch to say that Fidia's price-to-sales (or "P/S") ratio of 0.7x right now seems quite "middle-of-the-road" compared to the Machinery industry in Italy, seeing as it matches the P/S ratio of the wider industry. While this might not raise any eyebrows, if the P/S ratio is not justified investors could be missing out on a potential opportunity or ignoring looming disappointment.
Check out our latest analysis for Fidia
What Does Fidia's P/S Mean For Shareholders?
The revenue growth achieved at Fidia over the last year would be more than acceptable for most companies. One possibility is that the P/S is moderate because investors think this respectable revenue growth might not be enough to outperform the broader industry in the near future. If you like the company, you'd be hoping this isn't the case so that you could potentially pick up some stock while it's not quite in favour.
Want the full picture on earnings, revenue and cash flow for the company? Then our free report on Fidia will help you shine a light on its historical performance.Is There Some Revenue Growth Forecasted For Fidia?
The only time you'd be comfortable seeing a P/S like Fidia's is when the company's growth is tracking the industry closely.
If we review the last year of revenue growth, the company posted a terrific increase of 17%. Pleasingly, revenue has also lifted 33% in aggregate from three years ago, thanks to the last 12 months of growth. Therefore, it's fair to say the revenue growth recently has been superb for the company.
Comparing that to the industry, which is only predicted to deliver 2.6% growth in the next 12 months, the company's momentum is stronger based on recent medium-term annualised revenue results.
With this information, we find it interesting that Fidia is trading at a fairly similar P/S compared to the industry. It may be that most investors are not convinced the company can maintain its recent growth rates.
What We Can Learn From Fidia's P/S?
Fidia's stock has a lot of momentum behind it lately, which has brought its P/S level with the rest of the industry. It's argued the price-to-sales ratio is an inferior measure of value within certain industries, but it can be a powerful business sentiment indicator.
We've established that Fidia currently trades on a lower than expected P/S since its recent three-year growth is higher than the wider industry forecast. When we see strong revenue with faster-than-industry growth, we can only assume potential risks are what might be placing pressure on the P/S ratio. It appears some are indeed anticipating revenue instability, because the persistence of these recent medium-term conditions would normally provide a boost to the share price.
You need to take note of risks, for example - Fidia has 4 warning signs (and 3 which are concerning) we think you should know about.
If strong companies turning a profit tickle your fancy, then you'll want to check out this free list of interesting companies that trade on a low P/E (but have proven they can grow earnings).
New: AI Stock Screener & Alerts
Our new AI Stock Screener scans the market every day to uncover opportunities.
• Dividend Powerhouses (3%+ Yield)
• Undervalued Small Caps with Insider Buying
• High growth Tech and AI Companies
Or build your own from over 50 metrics.
Have feedback on this article? Concerned about the content? Get in touch with us directly. Alternatively, email editorial-team (at) simplywallst.com.
This article by Simply Wall St is general in nature. We provide commentary based on historical data and analyst forecasts only using an unbiased methodology and our articles are not intended to be financial advice. It does not constitute a recommendation to buy or sell any stock, and does not take account of your objectives, or your financial situation. We aim to bring you long-term focused analysis driven by fundamental data. Note that our analysis may not factor in the latest price-sensitive company announcements or qualitative material. Simply Wall St has no position in any stocks mentioned.
Have feedback on this article? Concerned about the content? Get in touch with us directly. Alternatively, email editorial-team@simplywallst.com
About BIT:FDA
Fidia
Designs, manufactures, and sells high speed milling systems, numerical controls, milling heads, and software systems.
Moderate risk with mediocre balance sheet.
Market Insights

Advertisement
Community Narratives
Finding The True Value Of A Logistics Powerhouse
Fair Value US$95.21|8.4% undervalued
NV
Community Contributor
Paradigm Biopharmaceuticals Will Lead Osteoarthritis Treatment with Zilosul's FDA Success
Fair Value AU$5.50|92.1% undervalued
AM
Community Contributor
Barrick Mining (ABX:CA): A Gold Hedge against a U.S. Shutdown
Fair Value CA$60.00|24.2% undervalued
GM
Community Contributor