Stock Analysis
- Italy
- /
- Auto Components
- /
- BIT:BRE
Shareholders in Brembo (BIT:BRE) are in the red if they invested a year ago


Investors can approximate the average market return by buying an index fund. But if you buy individual stocks, you can do both better or worse than that. Unfortunately the Brembo N.V. (BIT:BRE) share price slid 24% over twelve months. That's well below the market return of 27%. The silver lining (for longer term investors) is that the stock is still 2.1% higher than it was three years ago.
With that in mind, it's worth seeing if the company's underlying fundamentals have been the driver of long term performance, or if there are some discrepancies.
View our latest analysis for Brembo
To quote Buffett, 'Ships will sail around the world but the Flat Earth Society will flourish. There will continue to be wide discrepancies between price and value in the marketplace...' One flawed but reasonable way to assess how sentiment around a company has changed is to compare the earnings per share (EPS) with the share price.
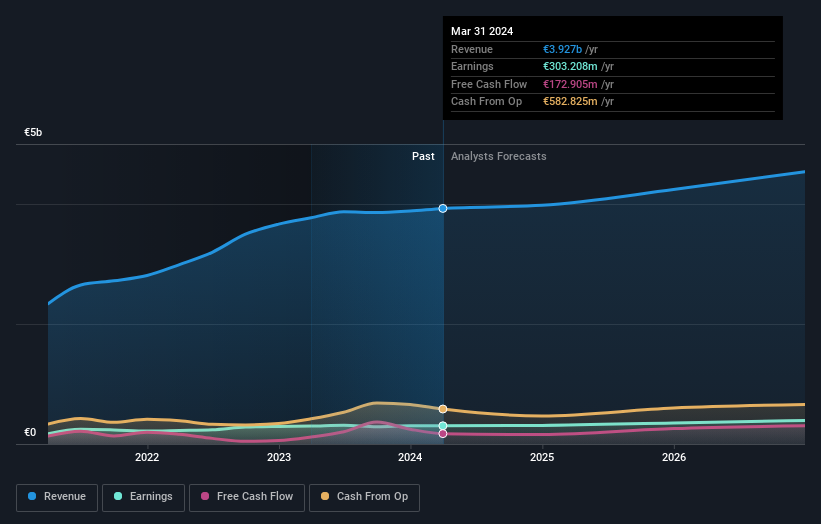
During the unfortunate twelve months during which the Brembo share price fell, it actually saw its earnings per share (EPS) improve by 0.8%. Of course, the situation might betray previous over-optimism about growth.
By glancing at these numbers, we'd posit that the the market had expectations of much higher growth, last year. But looking to other metrics might better explain the share price change.
Brembo managed to grow revenue over the last year, which is usually a real positive. Since the fundamental metrics don't readily explain the share price drop, there might be an opportunity if the market has overreacted.
You can see below how earnings and revenue have changed over time (discover the exact values by clicking on the image).
You can see how its balance sheet has strengthened (or weakened) over time in this free interactive graphic.
What About Dividends?
When looking at investment returns, it is important to consider the difference between total shareholder return (TSR) and share price return. Whereas the share price return only reflects the change in the share price, the TSR includes the value of dividends (assuming they were reinvested) and the benefit of any discounted capital raising or spin-off. It's fair to say that the TSR gives a more complete picture for stocks that pay a dividend. We note that for Brembo the TSR over the last 1 year was -22%, which is better than the share price return mentioned above. And there's no prize for guessing that the dividend payments largely explain the divergence!
A Different Perspective
Brembo shareholders are down 22% for the year (even including dividends), but the market itself is up 27%. However, keep in mind that even the best stocks will sometimes underperform the market over a twelve month period. Longer term investors wouldn't be so upset, since they would have made 4%, each year, over five years. If the fundamental data continues to indicate long term sustainable growth, the current sell-off could be an opportunity worth considering. It's always interesting to track share price performance over the longer term. But to understand Brembo better, we need to consider many other factors. To that end, you should be aware of the 1 warning sign we've spotted with Brembo .
For those who like to find winning investments this free list of undervalued companies with recent insider purchasing, could be just the ticket.
Please note, the market returns quoted in this article reflect the market weighted average returns of stocks that currently trade on Italian exchanges.
Valuation is complex, but we're helping make it simple.
Find out whether Brembo is potentially over or undervalued by checking out our comprehensive analysis, which includes fair value estimates, risks and warnings, dividends, insider transactions and financial health.
View the Free AnalysisHave feedback on this article? Concerned about the content? Get in touch with us directly. Alternatively, email editorial-team (at) simplywallst.com.
This article by Simply Wall St is general in nature. We provide commentary based on historical data and analyst forecasts only using an unbiased methodology and our articles are not intended to be financial advice. It does not constitute a recommendation to buy or sell any stock, and does not take account of your objectives, or your financial situation. We aim to bring you long-term focused analysis driven by fundamental data. Note that our analysis may not factor in the latest price-sensitive company announcements or qualitative material. Simply Wall St has no position in any stocks mentioned.
About BIT:BRE
Brembo
Brembo S.p.A., together with its subsidiaries, designs, develops, produces, and sells braking systems and components for cars, motorbikes, and industrial vehicles and machinery.
Flawless balance sheet average dividend payer.
