
Advertisement
- India
- /
- Renewable Energy
- /
- NSEI:RTNPOWER
Return Trends At RattanIndia Power (NSE:RTNPOWER) Aren't Appealing
To find a multi-bagger stock, what are the underlying trends we should look for in a business? Firstly, we'd want to identify a growing return on capital employed (ROCE) and then alongside that, an ever-increasing base of capital employed. Put simply, these types of businesses are compounding machines, meaning they are continually reinvesting their earnings at ever-higher rates of return. However, after investigating RattanIndia Power (NSE:RTNPOWER), we don't think it's current trends fit the mold of a multi-bagger.
Return On Capital Employed (ROCE): What is it?
If you haven't worked with ROCE before, it measures the 'return' (pre-tax profit) a company generates from capital employed in its business. To calculate this metric for RattanIndia Power, this is the formula:
Return on Capital Employed = Earnings Before Interest and Tax (EBIT) ÷ (Total Assets - Current Liabilities)
0.032 = ₹3.1b ÷ (₹186b - ₹89b) (Based on the trailing twelve months to June 2021).
So, RattanIndia Power has an ROCE of 3.2%. Ultimately, that's a low return and it under-performs the Renewable Energy industry average of 6.7%.
See our latest analysis for RattanIndia Power
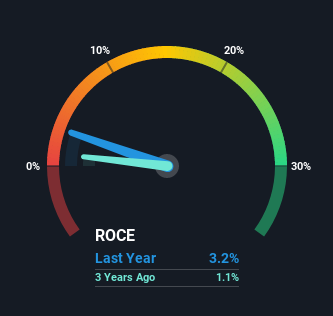
Historical performance is a great place to start when researching a stock so above you can see the gauge for RattanIndia Power's ROCE against it's prior returns. If you want to delve into the historical earnings, revenue and cash flow of RattanIndia Power, check out these free graphs here.
What Does the ROCE Trend For RattanIndia Power Tell Us?
Over the past five years, RattanIndia Power's ROCE has remained relatively flat while the business is using 44% less capital than before. When a company effectively decreases its assets base, it's not usually a sign to be optimistic on that company. In addition to that, since the ROCE doesn't scream "quality" at 3.2%, it's hard to get excited about these developments.
Another point to note, we noticed the company has increased current liabilities over the last five years. This is intriguing because if current liabilities hadn't increased to 48% of total assets, this reported ROCE would probably be less than3.2% because total capital employed would be higher.The 3.2% ROCE could be even lower if current liabilities weren't 48% of total assets, because the the formula would show a larger base of total capital employed. So with current liabilities at such high levels, this effectively means the likes of suppliers or short-term creditors are funding a meaningful part of the business, which in some instances can bring some risks.
Our Take On RattanIndia Power's ROCE
It's a shame to see that RattanIndia Power is effectively shrinking in terms of its capital base. And in the last five years, the stock has given away 54% so the market doesn't look too hopeful on these trends strengthening any time soon. On the whole, we aren't too inspired by the underlying trends and we think there may be better chances of finding a multi-bagger elsewhere.
If you'd like to know more about RattanIndia Power, we've spotted 3 warning signs, and 1 of them is a bit concerning.
While RattanIndia Power isn't earning the highest return, check out this free list of companies that are earning high returns on equity with solid balance sheets.
New: AI Stock Screener & Alerts
Our new AI Stock Screener scans the market every day to uncover opportunities.
• Dividend Powerhouses (3%+ Yield)
• Undervalued Small Caps with Insider Buying
• High growth Tech and AI Companies
Or build your own from over 50 metrics.
This article by Simply Wall St is general in nature. We provide commentary based on historical data and analyst forecasts only using an unbiased methodology and our articles are not intended to be financial advice. It does not constitute a recommendation to buy or sell any stock, and does not take account of your objectives, or your financial situation. We aim to bring you long-term focused analysis driven by fundamental data. Note that our analysis may not factor in the latest price-sensitive company announcements or qualitative material. Simply Wall St has no position in any stocks mentioned.
Have feedback on this article? Concerned about the content? Get in touch with us directly. Alternatively, email editorial-team (at) simplywallst.com.
About NSEI:RTNPOWER
RattanIndia Power
Together with its subsidiary, Poena Power Development Limited, engages in power generation, distribution, trading and transmission, and other ancillary and incidental activities in India.
Questionable track record with imperfect balance sheet.
Market Insights

Advertisement
Community Narratives
MicroVision will explode future revenue by 380.37% with a vision towards success
Fair Value US$60|98.4% undervalued
TH
Community Contributor
The Indispensable Artery for a New North American Economy
Fair Value CA$132.87|0.7% overvalued
TI
Community Contributor
Recently Updated Narratives
CE

cementafriend on Constellation Energy ·
Constellation Energy Dividends and Growth
Fair Value:US$348.054.7% overvalued
2 followersusers have followed this narrative
0 commentsusers have commented on this narrative
0 likesusers have liked this narrative
KH

Khagani on CoreWeave ·
CoreWeave's Revenue Expected to Rocket 77.88% in 5-Year Forecast
Fair Value:US$11033.5% undervalued
4 followersusers have followed this narrative
0 commentsusers have commented on this narrative
0 likesusers have liked this narrative
PO

PortfolioPlus on Bisalloy Steel Group ·
Bisalloy Steel Group will shine with a projected profit margin increase of 12.8%
Fair Value:AU$6.7118.0% undervalued
3 followersusers have followed this narrative
0 commentsusers have commented on this narrative
0 likesusers have liked this narrative
Popular Narratives
TH

TheWallstreetKing on MicroVision ·
MicroVision will explode future revenue by 380.37% with a vision towards success
Fair Value:US$6098.4% undervalued
107 followersusers have followed this narrative
10 commentsusers have commented on this narrative
21 likesusers have liked this narrative
AN


AnalystConsensusTarget on NVIDIA ·
NVDA: Expanding AI Demand Will Drive Major Data Center Investments Through 2026
Fair Value:US$250.3929.3% undervalued
936 followersusers have followed this narrative
6 commentsusers have commented on this narrative
24 likesusers have liked this narrative
OS


oscargarcia on Alphabet ·
The company that turned a verb into a global necessity and basically runs the modern internet, digital ads, smartphones, maps, and AI.
Fair Value:US$3405.8% undervalued
144 followersusers have followed this narrative
6 commentsusers have commented on this narrative
18 likesusers have liked this narrative