- India
- /
- Electronic Equipment and Components
- /
- NSEI:REDINGTON
3 Indian Dividend Stocks To Consider With At Least 3% Yield

Reviewed by Simply Wall St
Over the last 7 days, the Indian market has remained flat, although the Information Technology sector gained 4.0%. In a market that is up 44% over the past year with earnings forecasted to grow by 17% annually, selecting dividend stocks with at least a 3% yield can provide steady income and potential for growth.
Top 10 Dividend Stocks In India
| Name | Dividend Yield | Dividend Rating |
| Castrol India (BSE:500870) | 3.17% | ★★★★★★ |
| Balmer Lawrie Investments (BSE:532485) | 4.07% | ★★★★★★ |
| D. B (NSEI:DBCORP) | 5.05% | ★★★★★☆ |
| HCL Technologies (NSEI:HCLTECH) | 3.11% | ★★★★★☆ |
| VST Industries (BSE:509966) | 3.63% | ★★★★★☆ |
| Indian Oil (NSEI:IOC) | 8.37% | ★★★★★☆ |
| NMDC (BSE:526371) | 3.33% | ★★★★★☆ |
| Redington (NSEI:REDINGTON) | 3.06% | ★★★★★☆ |
| Bank of Baroda (NSEI:BANKBARODA) | 3.12% | ★★★★★☆ |
| PTC India (NSEI:PTC) | 3.79% | ★★★★★☆ |
Click here to see the full list of 20 stocks from our Top Indian Dividend Stocks screener.
Below we spotlight a couple of our favorites from our exclusive screener.
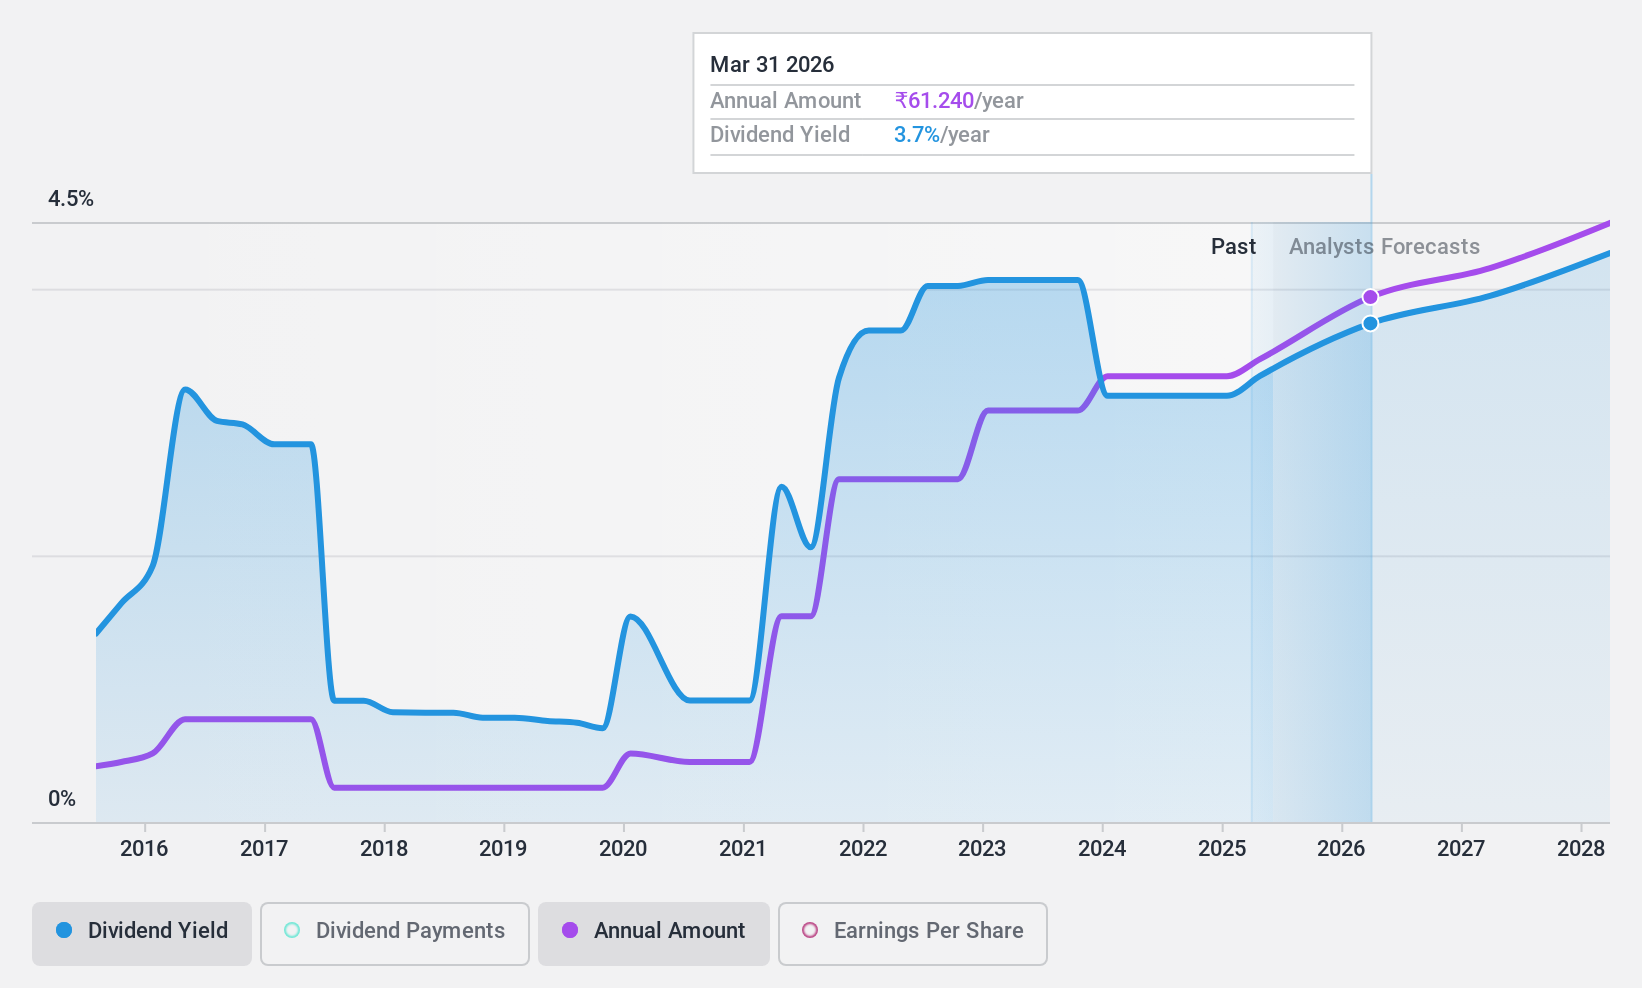
Bank of Baroda (NSEI:BANKBARODA)
Simply Wall St Dividend Rating: ★★★★★☆
Overview: Bank of Baroda Limited offers a range of banking products and services to individuals, government departments, and corporate customers both in India and internationally, with a market cap of ₹1.26 trillion.
Operations: Bank of Baroda Limited's revenue is primarily derived from Treasury (₹316.82 billion), Other Banking Operations (₹110.76 billion), Corporate/Wholesale Banking (₹502.78 billion), and Retail Banking, which includes Digital Banking (₹7.40 million) and Other Retail Banking (₹512.25 billion).
Dividend Yield: 3.1%
Bank of Baroda's dividend payments are well covered by earnings, with a low payout ratio of 20.9%, and are forecast to remain sustainable over the next three years. Despite this, its dividend history has been volatile over the past decade. Trading at 14.9% below estimated fair value, it offers good relative value compared to peers and industry standards. However, a high level of non-performing loans (2.9%) poses a risk to future financial stability and dividend reliability.
- Click here and access our complete dividend analysis report to understand the dynamics of Bank of Baroda.
- Upon reviewing our latest valuation report, Bank of Baroda's share price might be too pessimistic.
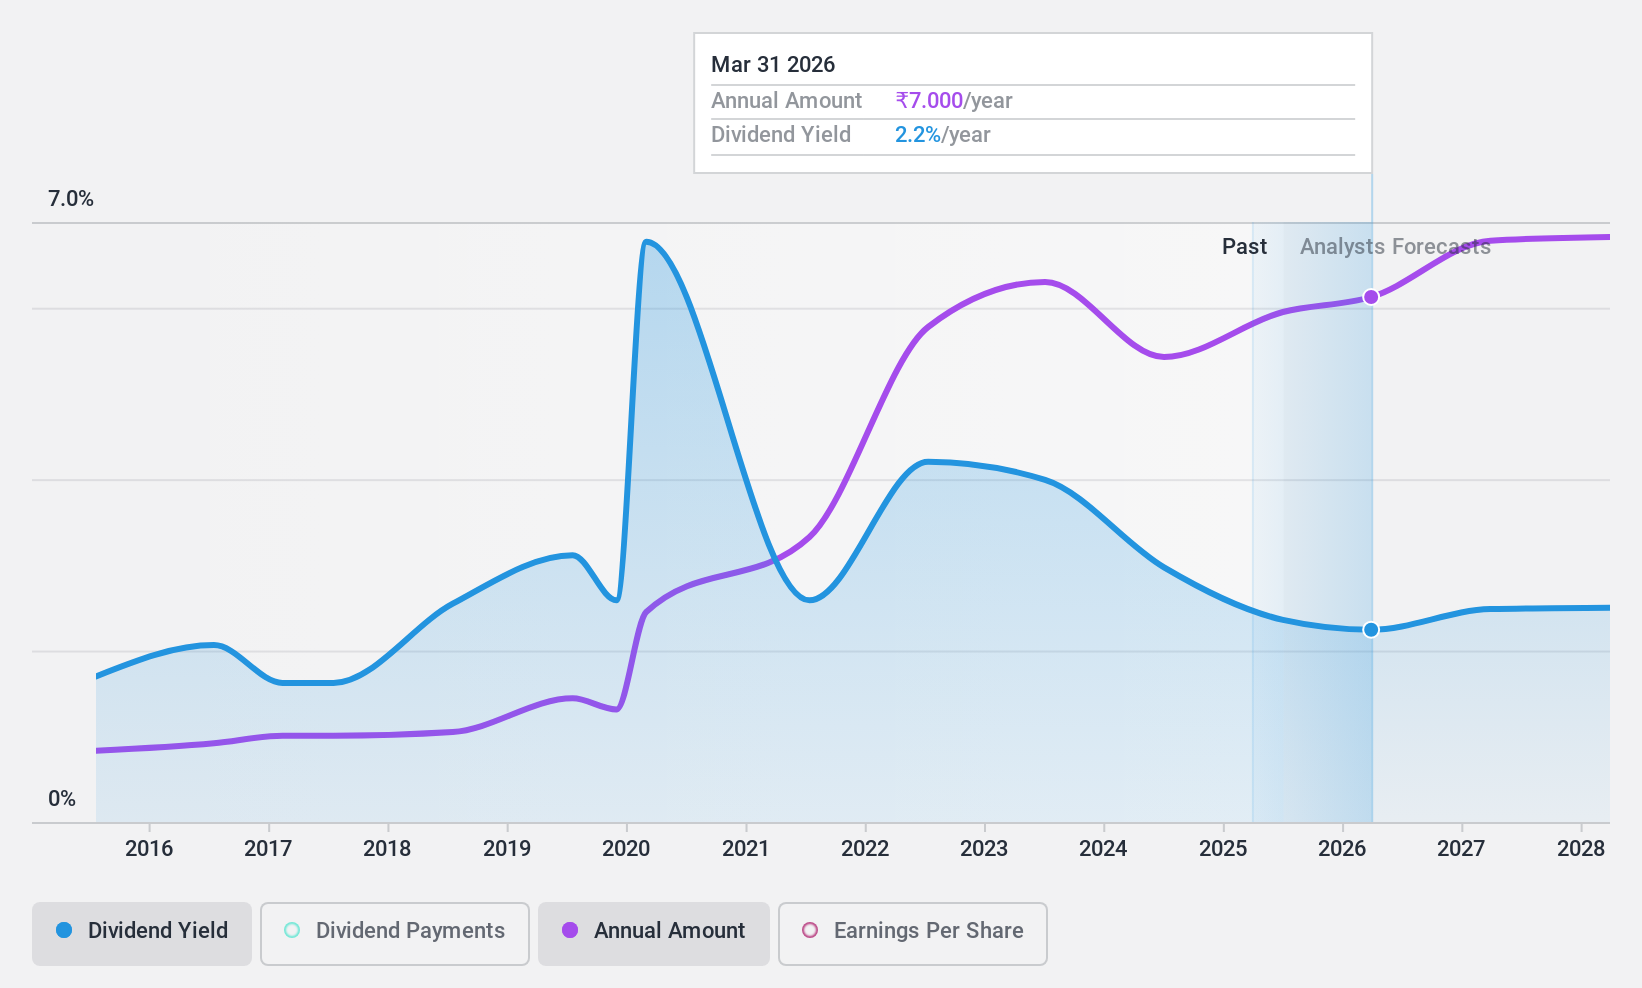
HCL Technologies (NSEI:HCLTECH)
Simply Wall St Dividend Rating: ★★★★★☆
Overview: HCL Technologies Limited provides software development, business process outsourcing, and infrastructure management services globally, with a market cap of ₹4.51 trillion.
Operations: HCL Technologies generates revenue from HCL Software ($1.42 billion), IT and Business Services ($9.91 billion), and Engineering and R&D Services ($2.16 billion).
Dividend Yield: 3.1%
HCL Technologies' dividend payments are covered by cash flows (64.3% payout ratio) and earnings (85.7% payout ratio), but its dividend history has been volatile over the past decade. Recent board changes and strategic expansions, including new global delivery centers and partnerships, may impact future performance. Despite a reasonable price-to-earnings ratio of 27.4x compared to the Indian market's 32.5x, significant insider selling in the past quarter raises concerns about long-term stability for dividend investors.
- Click to explore a detailed breakdown of our findings in HCL Technologies' dividend report.
- Insights from our recent valuation report point to the potential undervaluation of HCL Technologies shares in the market.
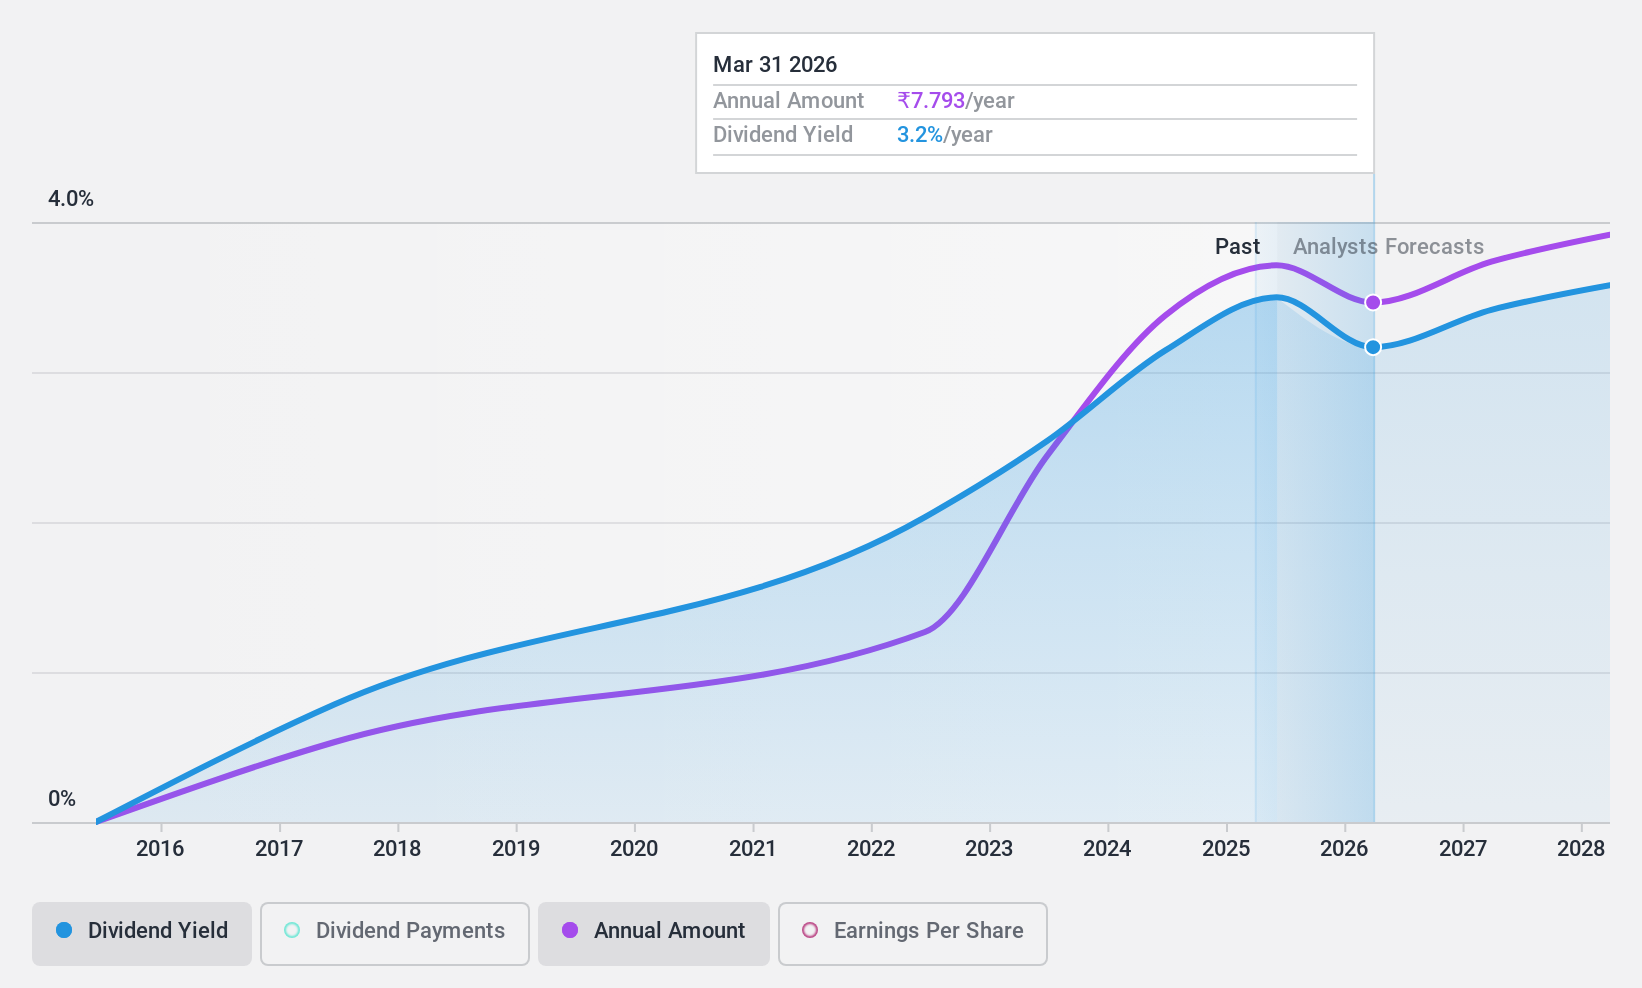
Redington (NSEI:REDINGTON)
Simply Wall St Dividend Rating: ★★★★★☆
Overview: Redington Limited provides supply chain solutions in India and internationally, with a market cap of ₹158.48 billion.
Operations: Redington Limited's revenue segments include IT products at ₹463,370 million and mobility products at ₹211,090 million.
Dividend Yield: 3.1%
Redington Limited's dividend payments are well-covered by earnings (39.8% payout ratio) and cash flows (50.6% cash payout ratio), but the company has a history of volatile dividends over the past decade. Recently, Redington declared a dividend of ₹6.20 per share for FY2024 and increased its authorized share capital, signaling potential future growth. Despite stable earnings in Q1 2025, net income saw a slight decline to ₹2.46 billion from ₹2.49 billion year-over-year, indicating cautious optimism for dividend stability moving forward.
- Click here to discover the nuances of Redington with our detailed analytical dividend report.
- Our valuation report here indicates Redington may be undervalued.
Make It Happen
- Reveal the 20 hidden gems among our Top Indian Dividend Stocks screener with a single click here.
- Have a stake in these businesses? Integrate your holdings into Simply Wall St's portfolio for notifications and detailed stock reports.
- Take control of your financial future using Simply Wall St, offering free, in-depth knowledge of international markets to every investor.
Interested In Other Possibilities?
- Explore high-performing small cap companies that haven't yet garnered significant analyst attention.
- Fuel your portfolio with companies showing strong growth potential, backed by optimistic outlooks both from analysts and management.
- Find companies with promising cash flow potential yet trading below their fair value.
This article by Simply Wall St is general in nature. We provide commentary based on historical data and analyst forecasts only using an unbiased methodology and our articles are not intended to be financial advice. It does not constitute a recommendation to buy or sell any stock, and does not take account of your objectives, or your financial situation. We aim to bring you long-term focused analysis driven by fundamental data. Note that our analysis may not factor in the latest price-sensitive company announcements or qualitative material. Simply Wall St has no position in any stocks mentioned.
The New Payments ETF Is Live on NASDAQ:
Money is moving to real-time rails, and a newly listed ETF now gives investors direct exposure. Fast settlement. Institutional custody. Simple access.
Explore how this launch could reshape portfolios
Sponsored ContentNew: AI Stock Screener & Alerts
Our new AI Stock Screener scans the market every day to uncover opportunities.
• Dividend Powerhouses (3%+ Yield)
• Undervalued Small Caps with Insider Buying
• High growth Tech and AI Companies
Or build your own from over 50 metrics.
Have feedback on this article? Concerned about the content? Get in touch with us directly. Alternatively, email editorial-team@simplywallst.com
About NSEI:REDINGTON
Redington
Distributes information technology, mobility, and other technology products in India, the Middle East, Turkey, Africa, and South Asian countries.
Solid track record with adequate balance sheet and pays a dividend.
Similar Companies
Market Insights

Weekly Picks

THE KINGDOM OF BROWN GOODS: WHY MGPI IS BEING CRUSHED BY INVENTORY & PRIMED FOR RESURRECTION


Why Vertical Aerospace (NYSE: EVTL) is Worth Possibly Over 13x its Current Price


The Quiet Giant That Became AI’s Power Grid
Recently Updated Narratives

Butler National (Buks) outperforms.


A tech powerhouse quietly powering the world’s AI infrastructure.


Keppel DC REIT (SGX: AJBU) is a resilient gem in the data center space.
Popular Narratives

MicroVision will explode future revenue by 380.37% with a vision towards success


Crazy Undervalued 42 Baggers Silver Play (Active & Running Mine)


