
Advertisement
- India
- /
- Electronic Equipment and Components
- /
- NSEI:NITIRAJ
Does The Market Have A Low Tolerance For Nitiraj Engineers Limited's (NSE:NITIRAJ) Mixed Fundamentals?

It is hard to get excited after looking at Nitiraj Engineers' (NSE:NITIRAJ) recent performance, when its stock has declined 20% over the past three months. We, however decided to study the company's financials to determine if they have got anything to do with the price decline. Long-term fundamentals are usually what drive market outcomes, so it's worth paying close attention. In this article, we decided to focus on Nitiraj Engineers' ROE.
Return on equity or ROE is a key measure used to assess how efficiently a company's management is utilizing the company's capital. In simpler terms, it measures the profitability of a company in relation to shareholder's equity.
Check out our latest analysis for Nitiraj Engineers
How Is ROE Calculated?
Return on equity can be calculated by using the formula:
Return on Equity = Net Profit (from continuing operations) ÷ Shareholders' Equity
So, based on the above formula, the ROE for Nitiraj Engineers is:
12% = ₹95m ÷ ₹797m (Based on the trailing twelve months to June 2024).
The 'return' refers to a company's earnings over the last year. That means that for every ₹1 worth of shareholders' equity, the company generated ₹0.12 in profit.
What Has ROE Got To Do With Earnings Growth?
We have already established that ROE serves as an efficient profit-generating gauge for a company's future earnings. Based on how much of its profits the company chooses to reinvest or "retain", we are then able to evaluate a company's future ability to generate profits. Assuming everything else remains unchanged, the higher the ROE and profit retention, the higher the growth rate of a company compared to companies that don't necessarily bear these characteristics.
A Side By Side comparison of Nitiraj Engineers' Earnings Growth And 12% ROE
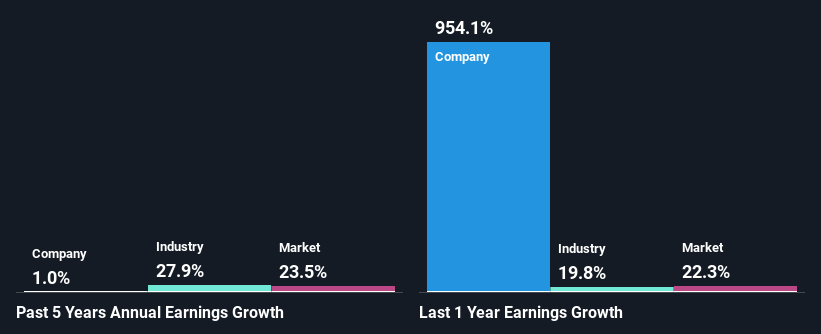
When you first look at it, Nitiraj Engineers' ROE doesn't look that attractive. However, its ROE is similar to the industry average of 10%, so we won't completely dismiss the company. However, Nitiraj Engineers has seen a flattish net income growth over the past five years, which is not saying much. Bear in mind, the company's ROE is not very high. So that could also be one of the reasons behind the company's flat growth in earnings.
Next, on comparing with the industry net income growth, we found that Nitiraj Engineers' reported growth was lower than the industry growth of 28% over the last few years, which is not something we like to see.
Earnings growth is an important metric to consider when valuing a stock. What investors need to determine next is if the expected earnings growth, or the lack of it, is already built into the share price. Doing so will help them establish if the stock's future looks promising or ominous. One good indicator of expected earnings growth is the P/E ratio which determines the price the market is willing to pay for a stock based on its earnings prospects. So, you may want to check if Nitiraj Engineers is trading on a high P/E or a low P/E, relative to its industry.
Is Nitiraj Engineers Efficiently Re-investing Its Profits?
Nitiraj Engineers has a low three-year median payout ratio of 13% (or a retention ratio of 87%) but the negligible earnings growth number doesn't reflect this as high growth usually follows high profit retention.
Additionally, Nitiraj Engineers has paid dividends over a period of seven years, which means that the company's management is determined to pay dividends even if it means little to no earnings growth.
Conclusion
In total, we're a bit ambivalent about Nitiraj Engineers' performance. Even though it appears to be retaining most of its profits, given the low ROE, investors may not be benefitting from all that reinvestment after all. The low earnings growth suggests our theory correct. Until now, we have only just grazed the surface of the company's past performance by looking at the company's fundamentals. So it may be worth checking this free detailed graph of Nitiraj Engineers' past earnings, as well as revenue and cash flows to get a deeper insight into the company's performance.
Valuation is complex, but we're here to simplify it.
Discover if Nitiraj Engineers might be undervalued or overvalued with our detailed analysis, featuring fair value estimates, potential risks, dividends, insider trades, and its financial condition.
Access Free AnalysisHave feedback on this article? Concerned about the content? Get in touch with us directly. Alternatively, email editorial-team (at) simplywallst.com.
This article by Simply Wall St is general in nature. We provide commentary based on historical data and analyst forecasts only using an unbiased methodology and our articles are not intended to be financial advice. It does not constitute a recommendation to buy or sell any stock, and does not take account of your objectives, or your financial situation. We aim to bring you long-term focused analysis driven by fundamental data. Note that our analysis may not factor in the latest price-sensitive company announcements or qualitative material. Simply Wall St has no position in any stocks mentioned.
About NSEI:NITIRAJ
Nitiraj Engineers
Manufactures and sells various electronic weighing scales and systems and digital fare meters for industrial and domestic sectors in India and internationally.
Flawless balance sheet second-rate dividend payer.
Market Insights


Advertisement
Community Narratives
The Future of Drug Testing? Fingerprint Tech Shows Serious Promise
Fair Value US$2.98|40.3% undervalued
JO
Community Contributor
Suncorp’s Next Chapter: Insurance-Only and Ready to Grow
Fair Value AU$22.83|8.8% undervalued
RO
Community Contributor
Thyssenkrupp Nucera Will Achieve Double-Digit Profits by 2030 Boosted by Hydrogen Growth
Fair Value €14.40|31.3% undervalued
CH
Community Contributor
Tesla’s Nvidia Moment – The AI & Robotics Inflection Point
Fair Value US$384.84|18.1% undervalued
BL
Community Contributor