
Advertisement
- India
- /
- Communications
- /
- NSEI:NELCO
Nelco Limited's (NSE:NELCO) Stock Has Been Sliding But Fundamentals Look Strong: Is The Market Wrong?

Nelco (NSE:NELCO) has had a rough three months with its share price down 30%. However, a closer look at its sound financials might cause you to think again. Given that fundamentals usually drive long-term market outcomes, the company is worth looking at. Specifically, we decided to study Nelco's ROE in this article.
Return on Equity or ROE is a test of how effectively a company is growing its value and managing investors’ money. In other words, it is a profitability ratio which measures the rate of return on the capital provided by the company's shareholders.
See our latest analysis for Nelco
How Do You Calculate Return On Equity?
The formula for ROE is:
Return on Equity = Net Profit (from continuing operations) ÷ Shareholders' Equity
So, based on the above formula, the ROE for Nelco is:
18% = ₹172m ÷ ₹937m (Based on the trailing twelve months to December 2022).
The 'return' is the yearly profit. One way to conceptualize this is that for each ₹1 of shareholders' capital it has, the company made ₹0.18 in profit.
Why Is ROE Important For Earnings Growth?
So far, we've learned that ROE is a measure of a company's profitability. Depending on how much of these profits the company reinvests or "retains", and how effectively it does so, we are then able to assess a company’s earnings growth potential. Assuming everything else remains unchanged, the higher the ROE and profit retention, the higher the growth rate of a company compared to companies that don't necessarily bear these characteristics.
Nelco's Earnings Growth And 18% ROE
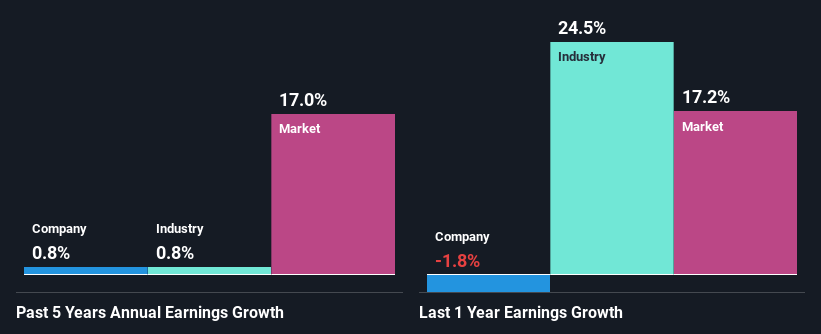
To begin with, Nelco seems to have a respectable ROE. Especially when compared to the industry average of 13% the company's ROE looks pretty impressive. However, we are curious as to how the high returns still resulted in flat growth for Nelco in the past five years. Therefore, there could be some other aspects that could potentially be preventing the company from growing. Such as, the company pays out a huge portion of its earnings as dividends, or is faced with competitive pressures.
Next, on comparing Nelco's net income growth with the industry, we found that the company's reported growth is similar to the industry average growth rate of 0.8% in the same period.
The basis for attaching value to a company is, to a great extent, tied to its earnings growth. The investor should try to establish if the expected growth or decline in earnings, whichever the case may be, is priced in. Doing so will help them establish if the stock's future looks promising or ominous. One good indicator of expected earnings growth is the P/E ratio which determines the price the market is willing to pay for a stock based on its earnings prospects. So, you may want to check if Nelco is trading on a high P/E or a low P/E, relative to its industry.
Is Nelco Efficiently Re-investing Its Profits?
Nelco has a low three-year median payout ratio of 22% (or a retention ratio of 78%) but the negligible earnings growth number doesn't reflect this as high growth usually follows high profit retention.
In addition, Nelco has been paying dividends over a period of at least ten years suggesting that keeping up dividend payments is way more important to the management even if it comes at the cost of business growth.
Conclusion
Overall, we are quite pleased with Nelco's performance. In particular, it's great to see that the company is investing heavily into its business and along with a high rate of return, that has resulted in a respectable growth in its earnings. Until now, we have only just grazed the surface of the company's past performance by looking at the company's fundamentals. You can do your own research on Nelco and see how it has performed in the past by looking at this FREE detailed graph of past earnings, revenue and cash flows.
Valuation is complex, but we're here to simplify it.
Discover if Nelco might be undervalued or overvalued with our detailed analysis, featuring fair value estimates, potential risks, dividends, insider trades, and its financial condition.
Access Free AnalysisHave feedback on this article? Concerned about the content? Get in touch with us directly. Alternatively, email editorial-team (at) simplywallst.com.
This article by Simply Wall St is general in nature. We provide commentary based on historical data and analyst forecasts only using an unbiased methodology and our articles are not intended to be financial advice. It does not constitute a recommendation to buy or sell any stock, and does not take account of your objectives, or your financial situation. We aim to bring you long-term focused analysis driven by fundamental data. Note that our analysis may not factor in the latest price-sensitive company announcements or qualitative material. Simply Wall St has no position in any stocks mentioned.
About NSEI:NELCO
Nelco
Engages in the provision of solutions in the areas of very small aperture terminals (VSAT) connectivity in India.
Flawless balance sheet with questionable track record.
Similar Companies
Market Insights


Advertisement
Community Narratives
The Future of Drug Testing? Fingerprint Tech Shows Serious Promise
Fair Value US$2.98|40.3% undervalued
JO
Community Contributor
Suncorp’s Next Chapter: Insurance-Only and Ready to Grow
Fair Value AU$22.83|7.9% undervalued
RO
Community Contributor
Thyssenkrupp Nucera Will Achieve Double-Digit Profits by 2030 Boosted by Hydrogen Growth
Fair Value €14.40|31.6% undervalued
CH
Community Contributor
Tesla’s Nvidia Moment – The AI & Robotics Inflection Point
Fair Value US$359.72|12.3% undervalued
BL
Community Contributor