Despite an already strong run, ITI Limited (NSE:ITI) shares have been powering on, with a gain of 32% in the last thirty days. Looking further back, the 23% rise over the last twelve months isn't too bad notwithstanding the strength over the last 30 days.
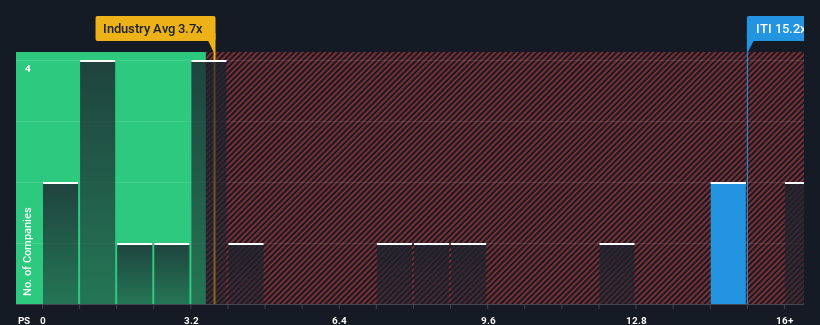
Since its price has surged higher, ITI may be sending strong sell signals at present with a price-to-sales (or "P/S") ratio of 15.2x, when you consider almost half of the companies in the Communications industry in India have P/S ratios under 3.7x and even P/S lower than 1.1x aren't out of the ordinary. However, the P/S might be quite high for a reason and it requires further investigation to determine if it's justified.
See our latest analysis for ITI

What Does ITI's Recent Performance Look Like?
With revenue growth that's exceedingly strong of late, ITI has been doing very well. Perhaps the market is expecting future revenue performance to outperform the wider market, which has seemingly got people interested in the stock. You'd really hope so, otherwise you're paying a pretty hefty price for no particular reason.
Although there are no analyst estimates available for ITI, take a look at this free data-rich visualisation to see how the company stacks up on earnings, revenue and cash flow.How Is ITI's Revenue Growth Trending?
The only time you'd be truly comfortable seeing a P/S as steep as ITI's is when the company's growth is on track to outshine the industry decidedly.
Retrospectively, the last year delivered an exceptional 67% gain to the company's top line. Still, revenue has barely risen at all from three years ago in total, which is not ideal. So it appears to us that the company has had a mixed result in terms of growing revenue over that time.
Comparing the recent medium-term revenue trends against the industry's one-year growth forecast of 32% shows it's noticeably less attractive.
In light of this, it's alarming that ITI's P/S sits above the majority of other companies. It seems most investors are ignoring the fairly limited recent growth rates and are hoping for a turnaround in the company's business prospects. Only the boldest would assume these prices are sustainable as a continuation of recent revenue trends is likely to weigh heavily on the share price eventually.
What Does ITI's P/S Mean For Investors?
The strong share price surge has lead to ITI's P/S soaring as well. We'd say the price-to-sales ratio's power isn't primarily as a valuation instrument but rather to gauge current investor sentiment and future expectations.
The fact that ITI currently trades on a higher P/S relative to the industry is an oddity, since its recent three-year growth is lower than the wider industry forecast. When we see slower than industry revenue growth but an elevated P/S, there's considerable risk of the share price declining, sending the P/S lower. Unless the recent medium-term conditions improve markedly, it's very challenging to accept these the share price as being reasonable.
And what about other risks? Every company has them, and we've spotted 2 warning signs for ITI you should know about.
It's important to make sure you look for a great company, not just the first idea you come across. So if growing profitability aligns with your idea of a great company, take a peek at this free list of interesting companies with strong recent earnings growth (and a low P/E).
New: AI Stock Screener & Alerts
Our new AI Stock Screener scans the market every day to uncover opportunities.
• Dividend Powerhouses (3%+ Yield)
• Undervalued Small Caps with Insider Buying
• High growth Tech and AI Companies
Or build your own from over 50 metrics.
Have feedback on this article? Concerned about the content? Get in touch with us directly. Alternatively, email editorial-team (at) simplywallst.com.
This article by Simply Wall St is general in nature. We provide commentary based on historical data and analyst forecasts only using an unbiased methodology and our articles are not intended to be financial advice. It does not constitute a recommendation to buy or sell any stock, and does not take account of your objectives, or your financial situation. We aim to bring you long-term focused analysis driven by fundamental data. Note that our analysis may not factor in the latest price-sensitive company announcements or qualitative material. Simply Wall St has no position in any stocks mentioned.
About NSEI:ITI
ITI
Engages in the manufacture, sale, and servicing of telecommunication equipment and building communication network infrastructures in India.
Mediocre balance sheet with minimal risk.
Similar Companies
Market Insights
Community Narratives


