
Advertisement
- India
- /
- Communications
- /
- NSEI:BIRLACABLE
Birla Cable's (NSE:BIRLACABLE) earnings growth rate lags the 40% CAGR delivered to shareholders
Birla Cable Limited (NSE:BIRLACABLE) shareholders have seen the share price descend 21% over the month. But in three years the returns have been great. Indeed, the share price is up a very strong 167% in that time. To some, the recent share price pullback wouldn't be surprising after such a good run. If the business can perform well for years to come, then the recent drop could be an opportunity.
Although Birla Cable has shed ₹723m from its market cap this week, let's take a look at its longer term fundamental trends and see if they've driven returns.
See our latest analysis for Birla Cable
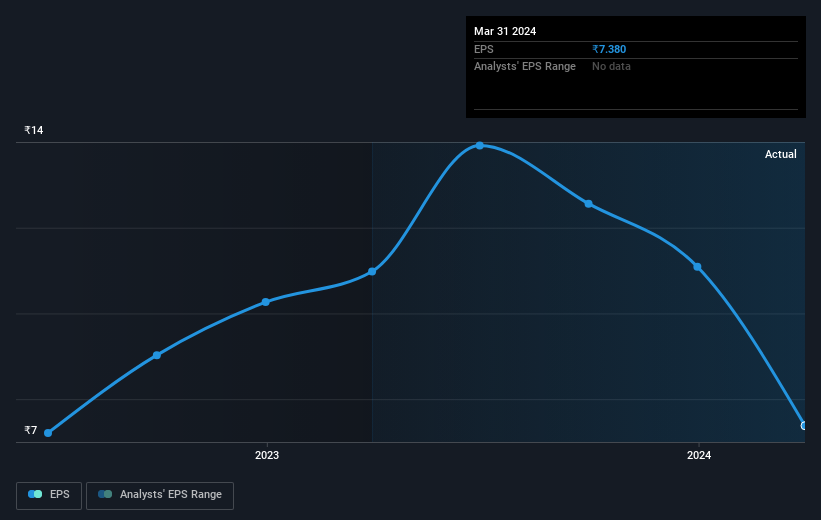
To quote Buffett, 'Ships will sail around the world but the Flat Earth Society will flourish. There will continue to be wide discrepancies between price and value in the marketplace...' One way to examine how market sentiment has changed over time is to look at the interaction between a company's share price and its earnings per share (EPS).
During three years of share price growth, Birla Cable achieved compound earnings per share growth of 39% per year. Notably, the 39% average annual share price gain matches up nicely with the EPS growth rate. That suggests that the market sentiment around the company hasn't changed much over that time. Rather, the share price has approximately tracked EPS growth.
The image below shows how EPS has tracked over time (if you click on the image you can see greater detail).
Before buying or selling a stock, we always recommend a close examination of historic growth trends, available here.
What About Dividends?
When looking at investment returns, it is important to consider the difference between total shareholder return (TSR) and share price return. The TSR is a return calculation that accounts for the value of cash dividends (assuming that any dividend received was reinvested) and the calculated value of any discounted capital raisings and spin-offs. It's fair to say that the TSR gives a more complete picture for stocks that pay a dividend. In the case of Birla Cable, it has a TSR of 175% for the last 3 years. That exceeds its share price return that we previously mentioned. This is largely a result of its dividend payments!
A Different Perspective
Birla Cable shareholders gained a total return of 16% during the year. But that return falls short of the market. It's probably a good sign that the company has an even better long term track record, having provided shareholders with an annual TSR of 17% over five years. Maybe the share price is just taking a breather while the business executes on its growth strategy. I find it very interesting to look at share price over the long term as a proxy for business performance. But to truly gain insight, we need to consider other information, too. Case in point: We've spotted 3 warning signs for Birla Cable you should be aware of, and 1 of them can't be ignored.
We will like Birla Cable better if we see some big insider buys. While we wait, check out this free list of undervalued stocks (mostly small caps) with considerable, recent, insider buying.
Please note, the market returns quoted in this article reflect the market weighted average returns of stocks that currently trade on Indian exchanges.
Valuation is complex, but we're here to simplify it.
Discover if Birla Cable might be undervalued or overvalued with our detailed analysis, featuring fair value estimates, potential risks, dividends, insider trades, and its financial condition.
Access Free AnalysisHave feedback on this article? Concerned about the content? Get in touch with us directly. Alternatively, email editorial-team (at) simplywallst.com.
This article by Simply Wall St is general in nature. We provide commentary based on historical data and analyst forecasts only using an unbiased methodology and our articles are not intended to be financial advice. It does not constitute a recommendation to buy or sell any stock, and does not take account of your objectives, or your financial situation. We aim to bring you long-term focused analysis driven by fundamental data. Note that our analysis may not factor in the latest price-sensitive company announcements or qualitative material. Simply Wall St has no position in any stocks mentioned.
About NSEI:BIRLACABLE
Birla Cable
Engages in the manufacture and sale of cables in India and internationally.
Adequate balance sheet with questionable track record.
Similar Companies
Market Insights

Advertisement
Community Narratives
MINISO's fair value is projected at 26.69 with an anticipated PE ratio shift of 20x
Fair Value US$24.03|11.0% undervalued
BE
Community Contributor
Procter & Gamble: A Dividend Giant Facing Slowing Growth
Fair Value US$119.81|23.3% overvalued
AN
Community Contributor
Eli Lilly's Future Growth Driven by Tirzepatide and Favorable Market Conditions
Fair Value US$1.19k|13.8% undervalued
EA
Community Contributor